June 16, 2026 a 11:43 am
WRB: Fundamental Ratio Analysis - W. R. Berkley Corporation
The stock of W. R. Berkley Corporation is a strong player within the insurance industry, with a diverse portfolio of commercial and personal insurance products. Despite a competitive market, the company's robust insurance and reinsurance offerings create potential for steady revenue streams. Investors should consider both market conditions and company fundamentals when evaluating this stock.
Fundamental Rating
The fundamental rating of W. R. Berkley Corporation reflects a solid standing with scope for improvement in some financial metrics.
| Category | Score | Visual |
|---|---|---|
| Discounted Cash Flow | 5 | |
| Return on Equity | 5 | |
| Return on Assets | 5 | |
| Debt to Equity | 3 | |
| Price to Earnings | 2 | |
| Price to Book | 1 |
Historical Rating
Recent data reflects consistent overall scores, with scores remaining unchanged over recent periods.
| Date | Overall Score | DCF | ROE | ROA | D/E | P/E | P/B |
|---|---|---|---|---|---|---|---|
| 2026-06-15 | 4 | 5 | 5 | 5 | 3 | 2 | 1 |
| Previous | 0 | 5 | 5 | 5 | 3 | 2 | 1 |
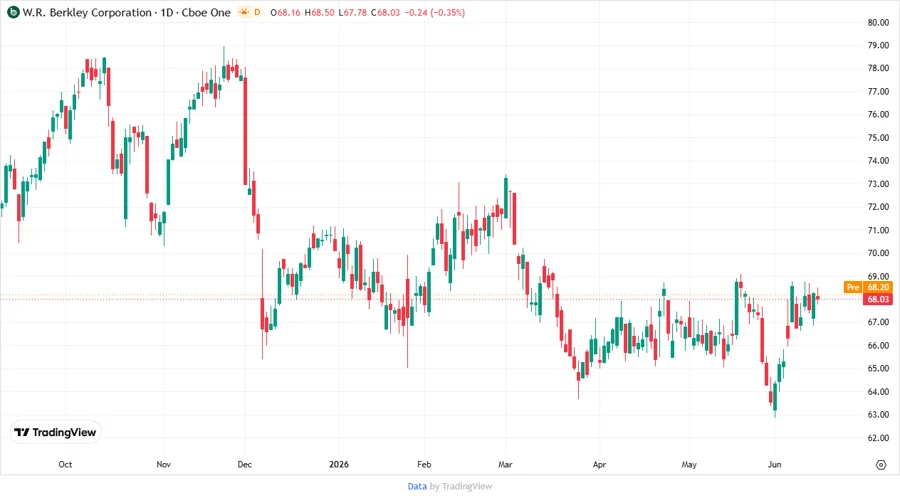
Analysts' Price Targets
The analysts' consensus holds a stable outlook with a marginally bullish sentiment on the stock pricing.
| High | Low | Median | Consensus |
|---|---|---|---|
| 80 | 58 | 69 | 69.1 |
Analysts' Sentiment
The analysts' sentiment displays a predominant inclination towards holding, albeit a noteworthy portion suggests buying.
| Recommendation | Count | Visual |
|---|---|---|
| Strong Buy | 0 | |
| Buy | 7 | |
| Hold | 18 | |
| Sell | 5 | |
| Strong Sell | 0 |
Conclusion
W. R. Berkley Corporation demonstrates strong fundamentals with a solid foothold in the insurance sector. The company's scores in return on equity and discounted cash flow are particularly commendable. Despite a stable hold consensus, market variables and sector dynamics could introduce fluctuations. Potential investors should evaluate the implications of current financial ratios critically. There remains potential for capital appreciation driven by fundamental strengths and market conditions.
Smart Data Insight
Master the Perfect Entry & Exit for this Stock
Don't leave your profits to chance. Historically, this stock follows specific seasonal patterns that institutional traders use to maximize returns.
- ✅ Identify the "Golden Buying Window"
- ✅ Avoid high-risk correction cycles
- ✅ Backtested data from the last 20+ years