
May 27, 2026 a 01:00 pm
WRB: Fundamental Ratio Analysis - W. R. Berkley Corporation
W. R. Berkley Corporation, a prominent player in the commercial insurance sector, offers diverse insurance products both domestically and internationally. The company's strategic segments—Insurance and Reinsurance & Monoline Excess—provide a robust framework aimed at managing comprehensive risk portfolios. With a unique blend of traditional and specialized coverages, WRB maintains a resilient position in the market.
Fundamental Rating
W. R. Berkley Corporation demonstrates a strong fundamental position with particular highlights in its discount cash flow and profitability ratios.
| Rating Category | Score | Visual |
|---|---|---|
| Discounted Cash Flow | 5 | |
| Return on Equity | 5 | |
| Return on Assets | 5 | |
| Debt to Equity | 3 | |
| Price to Earnings | 2 | |
| Price to Book | 1 |
Historical Rating
The historical data indicates consistent performance across major financial ratios, with a slight decline in the overall score compared to prior data.
| Date | Overall | DCF | ROE | ROA | Debt/Equity | P/E | P/B |
|---|---|---|---|---|---|---|---|
| 2026-05-26 | 4 | 5 | 5 | 5 | 3 | 2 | 1 |
| Previous | 0 | 5 | 5 | 5 | 3 | 2 | 1 |
Analyst Price Targets
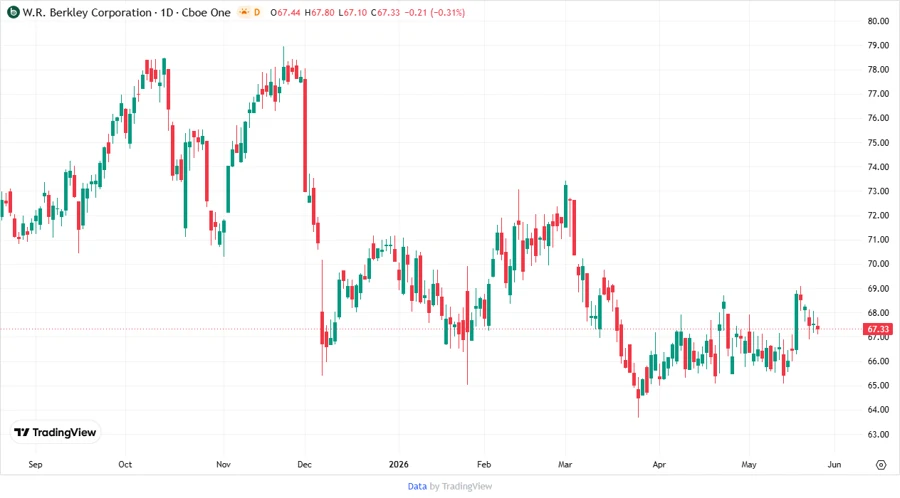
Analysts provide a conservative outlook on WRB with price predictions indicating a stable range within the industry norm.
| High | Low | Median | Consensus |
|---|---|---|---|
| $80 | $64 | $69 | $70.3 |
Analyst Sentiment
Current analyst ratings suggest a ‘Hold’ consensus, with the largest portion of analysts adopting a cautious stance.
| Rating | Count | Visual |
|---|---|---|
| Strong Buy | 0 | |
| Buy | 6 | |
| Hold | 20 | |
| Sell | 4 | |
| Strong Sell | 0 |
Conclusion
W. R. Berkley Corporation stands strong with its profound insurance and reinsurance solutions, maintaining a good overall financial rating. While the stock is rated as 'Hold' by analysts, its strong cash flow and equity returns present possible upside potential. The challenges lie mainly in its price to earnings and book value metrics which are below desirable levels. However, consistent historical performances suggest resilience. Prospective investors should weigh these analyses before making investment decisions.
Smart Data Insight
Master the Perfect Entry & Exit for this Stock
Don't leave your profits to chance. Historically, this stock follows specific seasonal patterns that institutional traders use to maximize returns.
- ✅ Identify the "Golden Buying Window"
- ✅ Avoid high-risk correction cycles
- ✅ Backtested data from the last 20+ years