
June 28, 2026 a 05:15 am
WRB: Fibonacci Analysis - W. R. Berkley Corporation
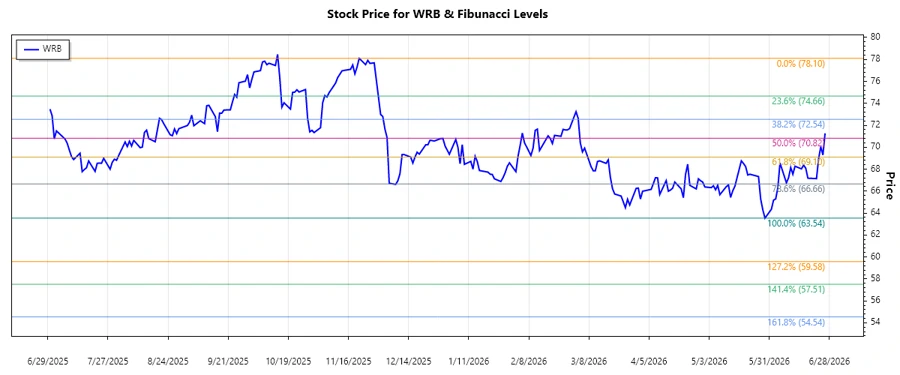
The W. R. Berkley Corporation (WRB) has recently shown a dominant downward trend over the analyzed period. The company, known for its diverse insurance solutions, has seen its stock prices react to broader market conditions and internal performance metrics. Investors should closely monitor the current retracement levels for potential buy opportunities if support levels hold.
Fibonacci Analysis
| Attribute | Value |
|---|---|
| Trend Start Date | 2025-11-28 |
| Trend End Date | 2026-06-26 |
| High Price (Date) | $78.1 (2025-11-21) |
| Low Price (Date) | $63.54 (2026-05-29) |
Fibonacci Levels
| Retracement Level | Price Level |
|---|---|
| 0.236 | $67.45 |
| 0.382 | $69.34 |
| 0.5 | $70.82 |
| 0.618 | $72.31 |
| 0.786 | $74.4 |
The current price is within the 0.236 - 0.382 Fibonacci retracement zone, which acts as potential resistance. This suggests that if the price fails to clear this zone, it may indicate a continuation of the downward trend.
Conclusion
The W. R. Berkley Corporation has experienced a significant decline in stock prices over the analyzed period, likely due to various market factors. With the current movement within the 0.236 to 0.382 Fibonacci retracement levels, this zone could act as significant resistance. A breakthrough above this range may signal a reversal, providing a potential buying opportunity. However, failure to break this level may result in further declines. Investors should remain vigilant and consider macroeconomic conditions, industry shifts, and company-specific news when making decisions.
Smart Data Insight
Master the Perfect Entry & Exit for this Stock
Don't leave your profits to chance. Historically, this stock follows specific seasonal patterns that institutional traders use to maximize returns.
- ✅ Identify the "Golden Buying Window"
- ✅ Avoid high-risk correction cycles
- ✅ Backtested data from the last 20+ years