November 18, 2025 a 03:15 pm
WRB: Fibonacci Analysis - W. R. Berkley Corporation
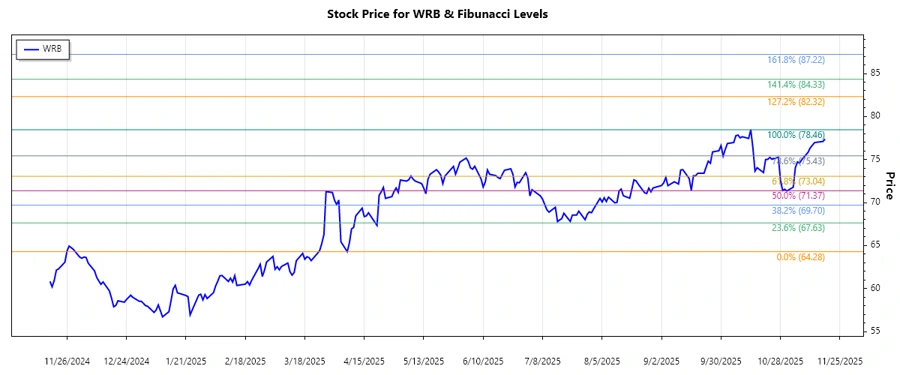
The W. R. Berkley Corporation has shown a consistent upward trend over the past several months, indicating strong investor confidence. This growth reflects the company's robust performance in its various insurance and reinsurance segments. As we conduct a technical Fibonacci analysis, it’s essential to identify potential support and resistance levels that might influence future price movements.
Fibonacci Analysis
| Detail | Value |
|---|---|
| Trend Period | 2025-04-07 to 2025-11-18 |
| High Point | $78.46 on 2025-10-14 |
| Low Point | $64.28 on 2025-04-07 |
| Fibonacci Levels |
|
| Current Price Position | Within the 0.236 retracement level at $77.375 |
| Technical Interpretation | The current price close to the 0.236 level suggests the possibility of a minor correction, yet it remains in proximity to recent highs, indicating potential support near this level. |
Conclusion
The W. R. Berkley Corporation shows a clear upward trajectory, benefiting from solid performance in the insurance and reinsurance markets. This strong upward trend, as highlighted by our analysis, suggests a lower risk for investors amidst favorable growth factors. However, the current positioning near a minor Fibonacci retracement level also signals caution, as market corrections could potentially impact price levels. As such, investors are advised to watch for breakouts or breakdowns from these key levels, which could signal broader market sentiments.
Smart Data Insight
Master the Perfect Entry & Exit for this Stock
Don't leave your profits to chance. Historically, this stock follows specific seasonal patterns that institutional traders use to maximize returns.
- ✅ Identify the "Golden Buying Window"
- ✅ Avoid high-risk correction cycles
- ✅ Backtested data from the last 20+ years