September 05, 2025 a 06:44 am

WRB: Fibonacci Analysis - W. R. Berkley Corporation
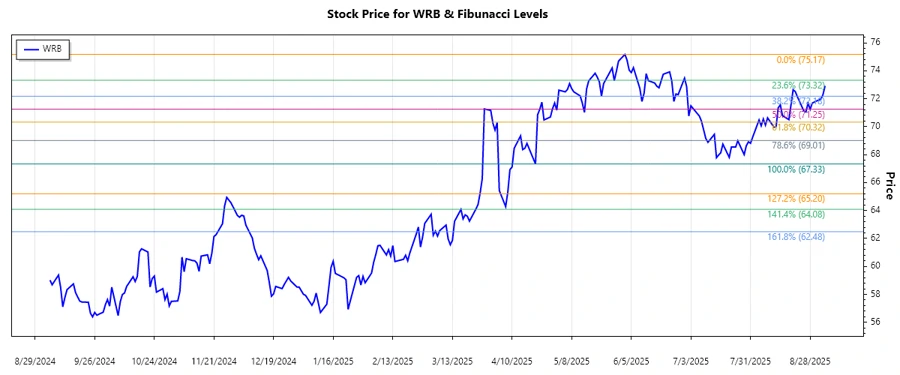
The W. R. Berkley Corporation has recently experienced a downward trend, reflective of broader market volatility. As an insurance and reinsurance provider, WRB often faces external pressures such as interest rate changes and regulatory challenges. Investors should keep a close eye on the company's strategic positioning to leverage industry dynamics. With its diversified portfolio, W. R. Berkley remains a resilient player, but caution is advised in the short term.
Fibonacci Analysis
| Trend | Start Date | End Date | High Price | High Date | Low Price | Low Date |
|---|---|---|---|---|---|---|
| Downtrend | 2025-06-02 | 2025-09-04 | $75.17 | 2025-06-02 | $67.33 | 2025-04-21 |
Fibonacci Levels
| Level | Retracement Price |
|---|---|
| 0.236 | $70.37 |
| 0.382 | $68.96 |
| 0.5 | $67.75 |
| 0.618 | $66.54 |
| 0.786 | $65.08 |
Current Price Position: The current price of $72.92 is positioned outside of the retracement zones, indicating potential resistance testing at higher levels.
Technical Interpretation: The current position outside the retracement zones suggests possible strength or a forming consolidation pattern, indicating resistance levels are being tested. This may either result in a trend reversal or continuation based on future data movements.
Conclusion
The downtrend observed in W. R. Berkley's stock price is symptomatic of prevailing market conditions impacting many financial sectors. The technical analysis highlights a potentially significant resistance level, suggesting a critical juncture. While the company's diversified operations offer a hedge against risk, market developments and economic factors can still materially impact its performance. Analysts should continuously assess external financial pressures and monitor any positive market recalibrations. In the long run, investors might find opportunities in WRB, provided there is a steadfast watch over fiscal reports and economic indicators.
Smart Data Insight
Master the Perfect Entry & Exit for this Stock
Don't leave your profits to chance. Historically, this stock follows specific seasonal patterns that institutional traders use to maximize returns.
- ✅ Identify the "Golden Buying Window"
- ✅ Avoid high-risk correction cycles
- ✅ Backtested data from the last 20+ years