
June 12, 2026 a 03:31 am

WRB: Dividend Analysis - W. R. Berkley Corporation
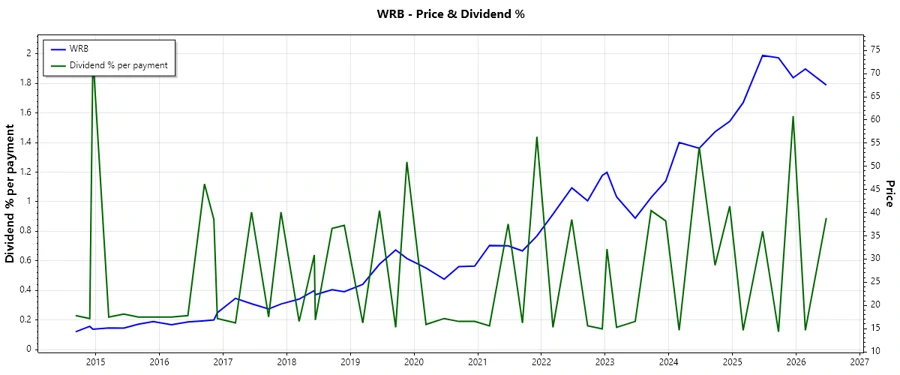
The W.R. Berkley Corporation has established itself as a reliable income-producing stock with a notable dividend history. This insurance powerhouse has consistently rewarded its shareholders with dividends for 41 years, demonstrating financial resilience and commitment to return value to shareholders. Despite market fluctuations, its disciplined financial strategy and growth in payouts offer a compelling investment opportunity for dividend-seeking investors.
Overview 📊
W. R. Berkley Corporation is prominently positioned in the financial services sector, known for its robust dividend yield and consistent dividend history. The company offers a dividend yield of 2.77%, supported by a current dividend per share of $1.77. With an impressive history of 41 consecutive years of dividend payments, the last recorded cut or suspension was notably absent, reinforcing its reputation for reliable shareholder returns.
| Detail | Value |
|---|---|
| Sector | Financial Services |
| Dividend yield | 2.77% |
| Current dividend per share | $1.77 |
| Dividend history | 41 years |
| Last cut or suspension | None |
Dividend History 📜
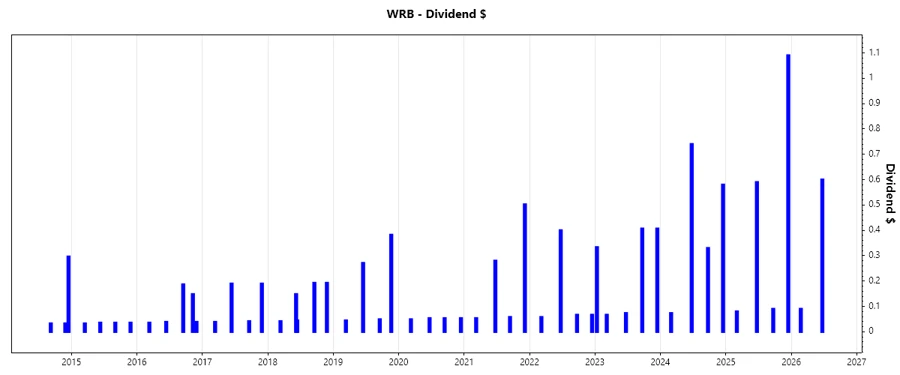
The dividend history of W. R. Berkley Corporation highlights its aptitude for generating stable income streams for shareholders. This long track record is a testament to its operational consistency and financial management acumen, contributing to investor confidence.
| Year | Dividend Per Share (USD) |
|---|---|
| 2026 | $0.69 |
| 2025 | $1.85 |
| 2024 | $1.72 |
| 2023 | $1.29 |
| 2022 | $0.59 |
Dividend Growth 📈
Analyzing the dividend growth rates is essential as it reflects the company's potential to enhance shareholder value through rising dividends. Over the past 3 years, the dividend growth rate stands at 0.46%, whereas over 5 years, it slightly increased to 0.55%.
| Time | Growth |
|---|---|
| 3 years | 0.46% |
| 5 years | 0.55% |
The average dividend growth is 0.55% over 5 years. This shows moderate but steady dividend growth, indicating potential for income enhancement over the long term.
Payout Ratio 🧾
The payout ratio is a pivotal measure of dividend safety and sustainability. W. R. Berkley Corporation maintains a prudent EPS-based payout ratio of 36.89% and a FCF-based payout ratio of 19.50%. Such ratios suggest the company retains ample earnings to fund growth initiatives while maintaining attractive dividends.
| Key figure | Ratio |
|---|---|
| EPS-based | 36.89% |
| Free cash flow-based | 19.50% |
This conservative payout approach suggests that W. R. Berkley Corporation is well-positioned to sustain and potentially grow its dividends, supporting long-term financial stability.
Cashflow & Capital Efficiency 💰
Assessing cash flow and capital efficiency offers insights into a company's operational success and its ability to generate cash from profits. Key metrics include the Free Cash Flow Yield and the Earnings Yield, both of which indicate significant value creation and financial prudence.
| Metric | 2025 | 2024 | 2023 |
|---|---|---|---|
| Free Cash Flow Yield | 12.47% | 15.27% | 14.88% |
| Earnings Yield | 6.40% | 7.51% | 7.15% |
| CAPEX to Operating Cash Flow | 4.37% | 2.87% | 1.81% |
| Stock-based Compensation to Revenue | 0.00% | 0.40% | 0.42% |
| Free Cash Flow / Operating Cash Flow Ratio | 95.33% | 97.13% | 98.19% |
The high Free Cash Flow yield and moderate capital expenditure level underscore strong cash generation capability, paving the way for sustainable dividends and reinvestment opportunities.
Balance Sheet & Leverage Analysis 📊
Analyzing the balance sheet and leverage ratios offers valuable insights into financial structure and risk. Key metrics include the Debt-to-Equity ratio and Net Debt to EBITDA, which signify the firm's leverage levels and financial obligations.
| Metric | 2025 | 2024 | 2023 |
|---|---|---|---|
| Debt-to-Equity | 0.29 | 0.34 | 0.38 |
| Debt-to-Assets | 0.06 | 0.07 | 0.08 |
| Debt-to-Capital | 0.23 | 0.25 | 0.28 |
| Net Debt to EBITDA | 0.23 | 0.39 | 0.79 |
| Current Ratio | 1.39 | 1.37 | 1.36 |
| Quick Ratio | 1.39 | 1.37 | 1.36 |
| Financial Leverage | 4.54 | 4.83 | 4.99 |
The solid balance sheet, with reasonable debt levels and comprehensive liquidity management, underscores W. R. Berkley Corporation's financial resilience and ability to navigate economic fluctuations.
Fundamental Strength & Profitability ✨
Examining fundamental strength and profitability involves understanding the core business operations and efficiency. Key metrics like Return on Equity and Net Profit Margin highlight operational success and value generation.
| Metric | 2025 | 2024 | 2023 |
|---|---|---|---|
| Return on Equity | 18.34% | 20.92% | 18.53% |
| Return on Assets | 4.04% | 4.33% | 3.71% |
| Margins: Net | 12.10% | 12.88% | 11.38% |
| Margins: EBIT | 16.35% | 17.53% | 15.50% |
| Margins: EBITDA | 16.13% | 16.28% | 15.33% |
| Margins: Gross | 19.81% | 22.89% | 22.44% |
The firm displays robust profitability metrics, with high return ratios and competitive margins, accentuating its core business strength and market competitiveness.
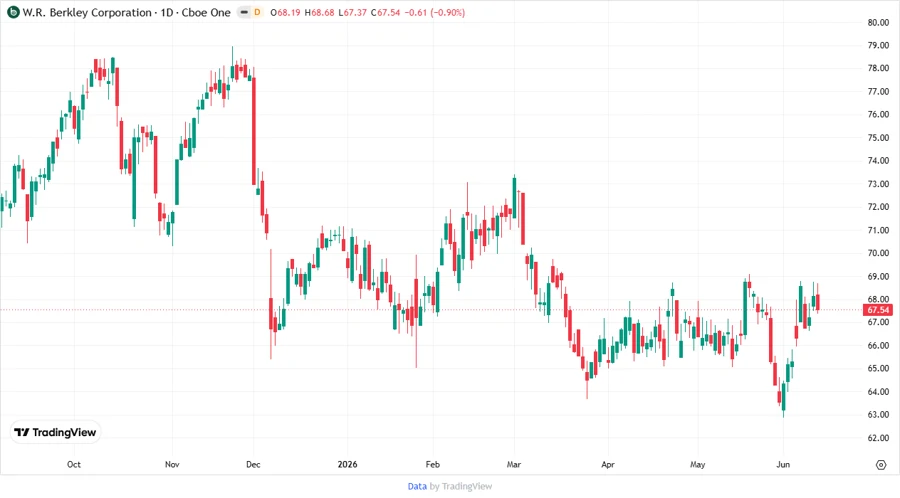
Price Development 💹
Dividend Scoring System ✅
| Category | Score | Representation |
|---|---|---|
| Dividend yield | 4 | |
| Dividend Stability | 5 | |
| Dividend growth | 3 | |
| Payout ratio | 5 | |
| Financial stability | 4 | |
| Dividend continuity | 5 | |
| Cashflow Coverage | 5 | |
| Balance Sheet Quality | 4 |
Total Score: 35/40
Rating 🗣️
W. R. Berkley Corporation is a formidable player in the financial services industry with a strong dividend record and sustainable payout ratio. The company’s balanced growth and prudent financial strategy make it a reliable choice for dividend investors seeking stability and steady income. Hence, it receives a strong buy recommendation for its impressive fundamentals and dividend reliability.
Smart Data Insight
Master the Perfect Entry & Exit for this Stock
Don't leave your profits to chance. Historically, this stock follows specific seasonal patterns that institutional traders use to maximize returns.
- ✅ Identify the "Golden Buying Window"
- ✅ Avoid high-risk correction cycles
- ✅ Backtested data from the last 20+ years