May 07, 2026 a 12:46 pm

WRB: Dividend Analysis - W. R. Berkley Corporation
W. R. Berkley Corporation presents a formidable dividend profile backed by stability and consistent growth. The company's long-standing dividend history underscores its reliability in returning value to shareholders. Key metrics indicate a strong financial foundation, yet careful analysis of its payout ratios and growth trends is essential for prospective investors.
📊 Overview
W. R. Berkley Corporation operates within the financial sector, offering a respectable dividend yield complemented by a long history of payout reliability. Prospective investors can take confidence in its 41 years of dividend history, highlighting the company's resilient financial practices.
| Metric | Value |
|---|---|
| Sector | Financial |
| Dividend yield | 2.62 % |
| Current dividend per share | 1.77 USD |
| Dividend history | 41 years |
| Last cut or suspension | None |
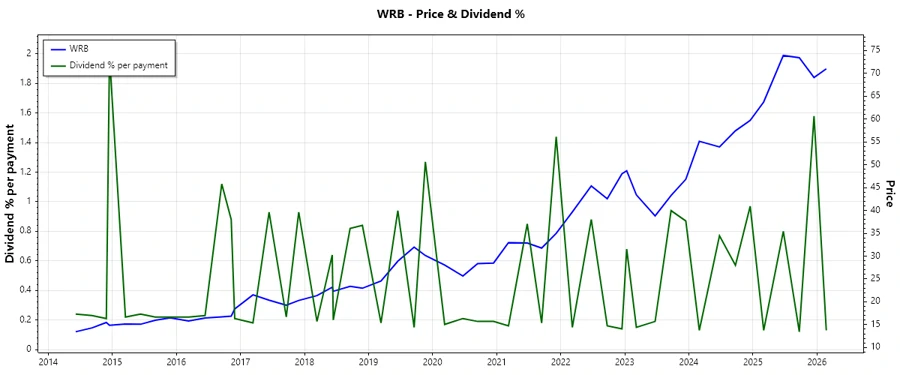
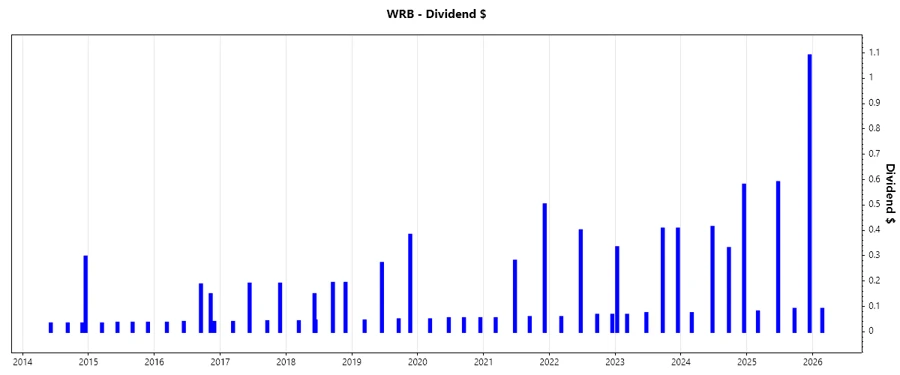
🗣️ Dividend History
The company's extensive dividend history is a testament to its commitment to shareholder returns. This historical perspective not only provides an insight into dividend sustainability but also reflects the economic stability of W. R. Berkley Corporation over decades.
| Year | Dividend Per Share (USD) |
|---|---|
| 2026 | 0.09 |
| 2025 | 1.85 |
| 2024 | 1.40 |
| 2023 | 1.29 |
| 2022 | 0.59 |
📈 Dividend Growth
Dividend growth is a crucial indicator of a company's financial health and strategic prioritization of shareholder returns. Analyzing growth over recent years gives investors a snapshot of the company's revenue progression and management efficiency.
| Time | Growth |
|---|---|
| 3 years | 0.46 % |
| 5 years | 0.55 % |
The average dividend growth is 0.55 % over 5 years. This shows moderate but steady dividend growth.
✅ Payout Ratio
Payout ratios provide insight into the proportion of earnings distributed as dividends. A balanced payout ratio indicates sustainable dividend practices that do not compromise financial stability.
| Key figure ratio | Value |
|---|---|
| EPS-based | 36.89 % |
| Free cash flow-based | 19.50 % |
The EPS-based payout ratio of 36.89 % and FCF-based ratio of 19.50 % are considered healthy, allowing for reinvestment into growth initiatives while maintaining dividend commitments.
💰 Cashflow & Capital Efficiency
Evaluating cash flow and capital efficiency is vital for understanding a company's liquidity and operational efficiency. Free cash flow directly impacts dividend sustainability and operational funding.
| Metric | 2023 | 2024 | 2025 |
|---|---|---|---|
| Free Cash Flow Yield | 13.69% | 15.27% | 12.47% |
| Earnings Yield | 7.24% | 7.51% | 6.40% |
| CAPEX to Operating Cash Flow | 1.81% | 2.87% | 4.37% |
| Stock-based Compensation to Revenue | 0.42% | 0.40% | 0.28% |
| Free Cash Flow / Operating Cash Flow Ratio | 95.33% | 97.13% | 95.33% |
The company demonstrates stable cash flows with efficient CAPEX management, showcasing strong liquidity allowing for consistent dividend payouts and investments.
⚖️ Balance Sheet & Leverage Analysis
Analyzing the balance sheet and leverage helps determine the company’s financial stability and risk. These metrics guide understanding of a company’s capital structure and debt obligations.
| Metric | 2023 | 2024 | 2025 |
|---|---|---|---|
| Debt-to-Equity | 0.38 | 0.34 | 0.29 |
| Debt-to-Assets | 0.08 | 0.07 | 0.06 |
| Debt-to-Capital | 0.28 | 0.25 | 0.23 |
| Net Debt to EBITDA | 0.79 | 0.39 | 0.13 |
| Current Ratio | 1.36 | 1.37 | 1.38 |
| Quick Ratio | 1.36 | 1.37 | 1.39 |
| Financial Leverage | 5.00 | 4.83 | 4.54 |
Solid leverage ratios imply a well-managed debt structure, providing a cushion during economic downturns and ensuring operational stability.
📈 Fundamental Strength & Profitability
The company's fundamental strength and profitability ratios are critical in assessing its ability to generate gains and sustain business operations over time. High returns on equity and assets indicate efficient use of resources.
| Metric | 2023 | 2024 | 2025 |
|---|---|---|---|
| Return on Equity | 0.19 | 0.21 | 0.18 |
| Return on Assets | 0.04 | 0.04 | 0.04 |
| Margins: Net | 11.38% | 12.88% | 12.10% |
| Margins: EBIT | 15.50% | 17.53% | 16.35% |
| Margins: EBITDA | 15.33% | 16.28% | 16.13% |
| Margins: Gross | 22.44% | 22.89% | 19.81% |
| Research & Development to Revenue | 0% | 0% | 0% |
The company maintains strong profitability metrics with efficient operational margins, suggesting a robust capacity for revenue generation and cost management.
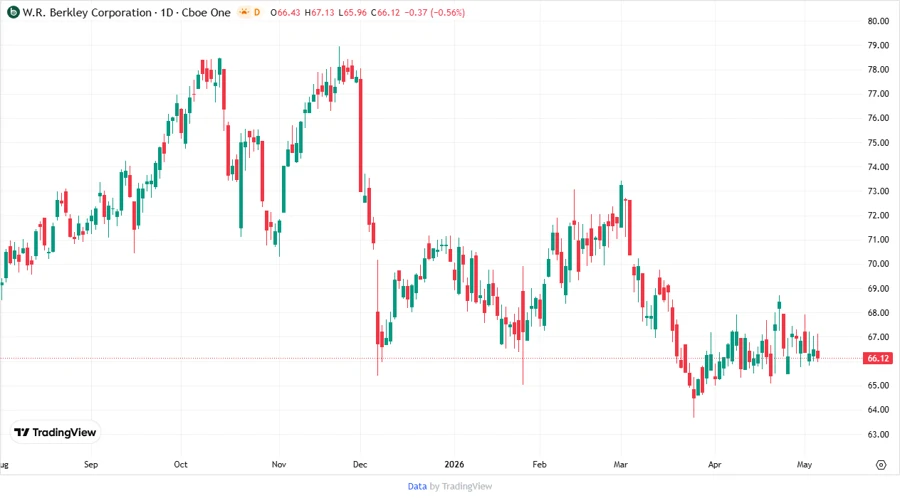
🕒 Price Development
🎯 Dividend Scoring System
| Criterion | Score | Indicator |
|---|---|---|
| Dividend yield | 4 | |
| Dividend Stability | 5 | |
| Dividend growth | 3 | |
| Payout ratio | 5 | |
| Financial stability | 5 | |
| Dividend continuity | 5 | |
| Cashflow Coverage | 4 | |
| Balance Sheet Quality | 5 |
Score: 36 / 40
📝 Rating
W. R. Berkley Corporation exhibits strong financial stability and a resilient dividend history, making it an attractive candidate for income-seeking investors. Its low payout ratios and expanding growth metrics support a positive outlook for sustainable dividend yield. We recommend a 'Buy' rating for long-term investors focused on income generation combined with capital stability.
Smart Data Insight
Master the Perfect Entry & Exit for this Stock
Don't leave your profits to chance. Historically, this stock follows specific seasonal patterns that institutional traders use to maximize returns.
- ✅ Identify the "Golden Buying Window"
- ✅ Avoid high-risk correction cycles
- ✅ Backtested data from the last 20+ years