January 15, 2026 a 02:46 am

WRB: Dividend Analysis - W. R. Berkley Corporation
The W. R. Berkley Corporation presents a compelling dividend profile with a tradition of consistent payouts and moderate growth. Its robust financial foundation underpins a sustainable dividend strategy, making it a noteworthy consideration for income-focused investors. While there was a recent cut in 2022, the company's long history of dividend payments speaks to its commitment to shareholder returns.
📊 Overview
The overview highlights key metrics that illustrate WRB's dividend viability within its operational sector.
| Metric | Value |
|---|---|
| Sector | Insurance |
| Dividend Yield | 2.68% |
| Current Dividend per Share | 1.33 USD |
| Dividend History | 40 years |
| Last Cut or Suspension | 2022 |
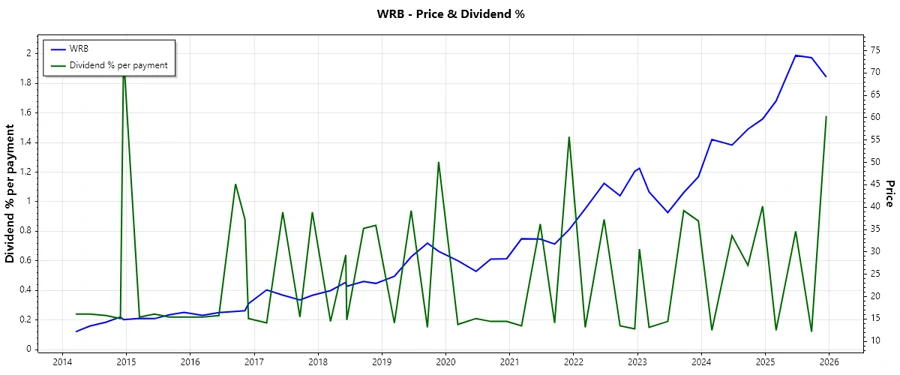
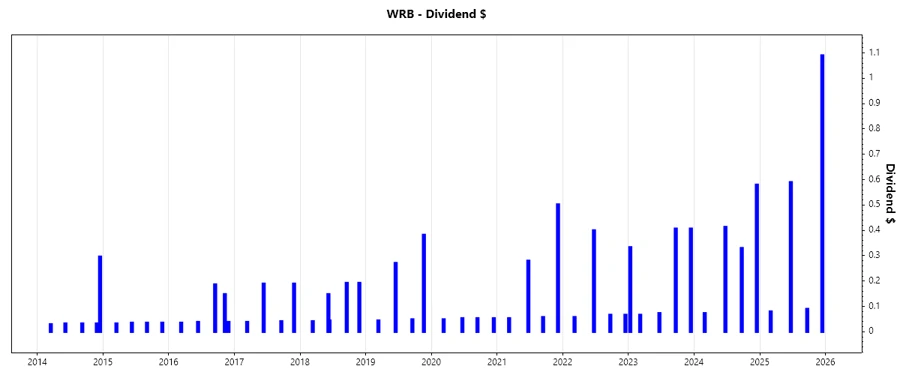
🗣️ Dividend History
Analyzing dividend history is essential for assessing a company's commitment to providing returns to shareholders over time. Below is the history of the last 5 dividend payments, visualized further with a stock chart for contextual historical performance.
| Year | Dividend Per Share (USD) |
|---|---|
| 2025 | 1.85 |
| 2024 | 1.40 |
| 2023 | 1.29 |
| 2022 | 0.59 |
| 2021 | 0.89 |
📈 Dividend Growth
The analysis of dividend growth provides insights into the sustainability and long-term potential of dividends. Notably, moderate growth in dividends encourages investor confidence.
| Time | Growth |
|---|---|
| 3 years | 0.46% |
| 5 years | 0.55% |
The average dividend growth is 0.55% over 5 years. This shows moderate but steady dividend growth.
⚖️ Payout Ratio
Payout ratios are critical in assessing how well a company's earnings cover its dividend payments, reflecting financial health and future payout sustainability.
| Key Figure Ratio | Value |
|---|---|
| EPS-based | 27.73% |
| Free cash flow-based | 15.19% |
The EPS payout ratio is commendably low at 27.73%, indicating significant earnings retention for growth. Additionally, the free cash flow payout ratio of 15.19% assures substantial coverage for dividends, showcasing robust cash flow management.
🏦 Cashflow & Capital Efficiency
The evaluation of cash flows and capital efficiency helps investors understand operational viability and investment returns.
| Year | 2022 | 2023 | 2024 |
|---|---|---|---|
| Free Cash Flow Yield | 12.41% | 14.88% | 15.27% |
| Earnings Yield | 6.81% | 7.15% | 7.51% |
| CAPEX to Operating Cash Flow | 2.05% | 1.81% | 2.87% |
| Stock-based Compensation to Revenue | 0.44% | 0.42% | 0.40% |
| Free Cash Flow / Operating Cash Flow Ratio | 97.95% | 98.19% | 97.13% |
The robust free cash flow yield alongside commendable capital efficiency ratios underscores WRB's financial strength, suitable for sustainable dividend payouts and potential capital growth.
💼 Balance Sheet & Leverage Analysis
Understanding the balance sheet health and leverage is essential for gauging financial stability and debt management capabilities.
| Year | 2022 | 2023 | 2024 |
|---|---|---|---|
| Debt-to-Equity | 42.04% | 38.13% | 33.84% |
| Debt-to-Assets | 8.38% | 7.64% | 7.00% |
| Debt-to-Capital | 29.60% | 27.60% | 25.28% |
| Net Debt to EBITDA | 0.73 | 0.79 | 0.39 |
| Current Ratio | - | - | - |
| Quick Ratio | - | - | - |
| Financial Leverage | 5.02 | 4.99 | 4.83 |
The decreasing trend in debt ratios and stable leverage indicates strong financial management, providing a reassuring buffer for economic downturns.
🔍 Fundamental Strength & Profitability
An examination of fundamental strength and profitability aids in understanding a company's financial health and performance efficiency.
| Year | 2022 | 2023 | 2024 |
|---|---|---|---|
| Return on Equity | 20.47% | 18.53% | 20.92% |
| Return on Assets | 4.08% | 3.71% | 4.33% |
| Net Margin | 12.37% | 11.38% | 12.88% |
| EBIT Margin | 16.57% | 15.50% | 17.53% |
| EBITDA Margin | 17.07% | 15.33% | 16.28% |
| Gross Margin | 21.83% | 22.44% | 22.89% |
| Research & Development to Revenue | 0% | 0% | 0% |
WRB demonstrates solid profitability margins and excellent return metrics, reinforcing its position as a financially resilient entity.
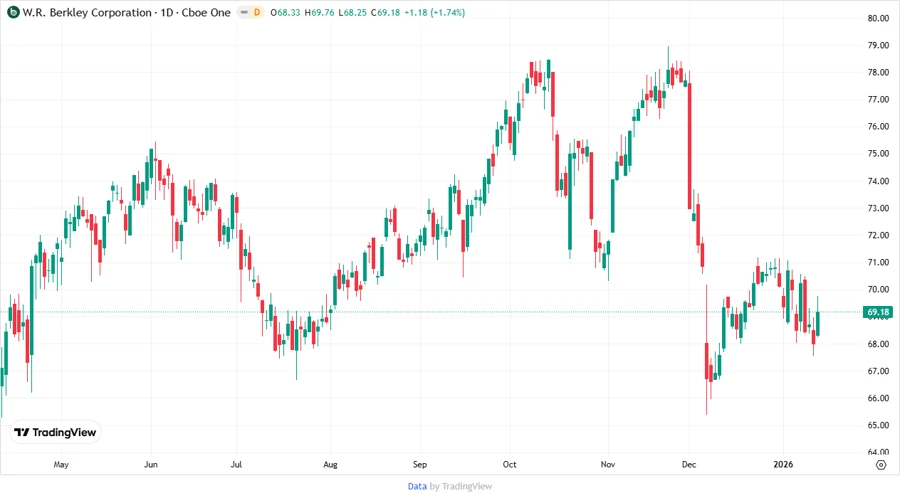
📉 Price Development
✅ Dividend Scoring System
| Criteria | Score | Bar |
|---|---|---|
| Dividend Yield | 3 | |
| Dividend Stability | 4 | |
| Dividend Growth | 3 | |
| Payout Ratio | 5 | |
| Financial Stability | 4 | |
| Dividend Continuity | 4 | |
| Cashflow Coverage | 5 | |
| Balance Sheet Quality | 4 |
Total Score: 32/40
⚠️ Rating
W. R. Berkley Corporation exhibits sound financial health with a strong commitment to dividend payments, making it a viable option for income investors seeking stable returns. Despite some recent variability in payments, its long track record and robust financial ratios reinforce confidence in its dividend prospects.