August 09, 2025 a 07:31 am

WRB: Dividend Analysis - W. R. Berkley Corporation
W. R. Berkley Corporation showcases impressive dividend consistency with a history spanning over 40 years without any recent cuts or suspensions. This steadfastness underscores their commitment to shareholder returns, which is particularly noteworthy for investors seeking long-term value. The company's solid dividend yield of 2.14% points to its strong ability to reward its shareholders.
📊 Overview
The overview provides insights into the sector and dividend performance of W. R. Berkley Corporation, which is instrumental for understanding its market positioning and shareholder value proposition.
| Indicator | Details |
|---|---|
| Sector | Insurance |
| Dividend Yield | 2.14% |
| Current Dividend Per Share | 1.33 USD |
| Dividend History | 40 years |
| Last Cut or Suspension | None |
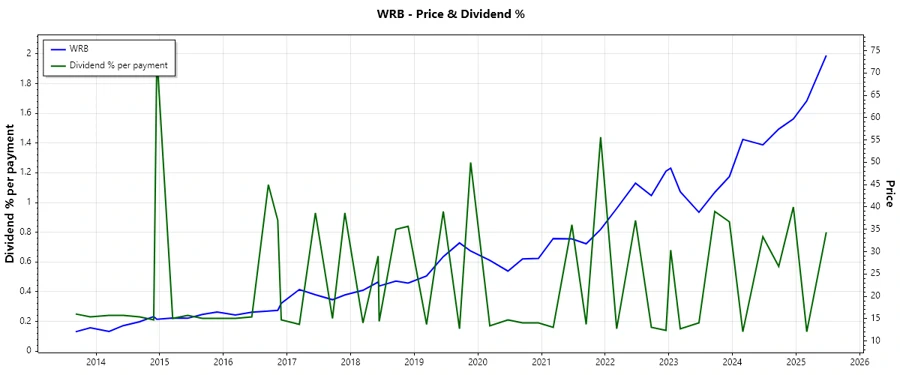
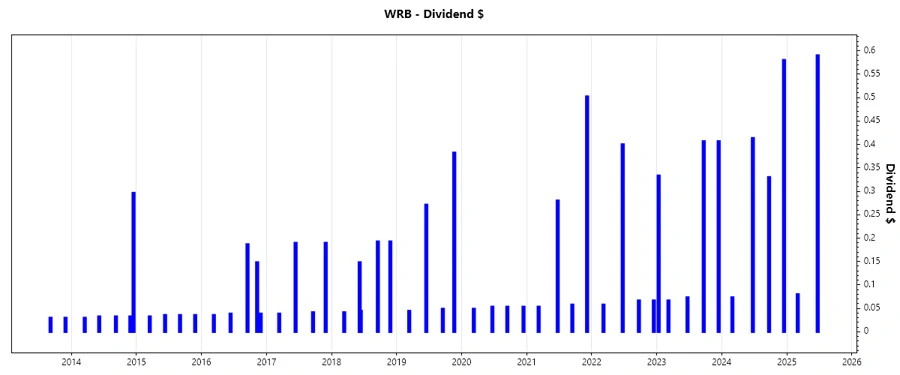
📈 Dividend History
Consistent dividend payments highlight the financial resilience and long-term commitment of a company to its shareholders. Historic trends in dividends can indicate future reliability and performance.
| Year | Dividend Per Share (USD) |
|---|---|
| 2025 | 0.67 |
| 2024 | 1.40 |
| 2023 | 1.29 |
| 2022 | 0.59 |
| 2021 | 0.89 |
📈 Dividend Growth
Dividend growth reflects the company’s capability to enhance shareholder value over time. Increasing dividends are often a result of profitable growth which signals robust financial performance.
| Time | Growth |
|---|---|
| 3 years | 16.06% |
| 5 years | 13.34% |
The average dividend growth is 13.34% over 5 years. This shows moderate but steady dividend growth.
⚖️ Payout Ratio
Payout ratios are crucial gauges of a company's ability to maintain and potentially grow its dividend payments. A high ratio may suggest limited capacity to increase dividends, whereas a low ratio indicates room for growth.
| Key Figure | Ratio |
|---|---|
| EPS-based | 30.01% |
| Free Cash Flow-based | 13.99% |
The current payout ratio based on EPS is at 30.01%, illustrating a conservative approach, allowing room for potential dividend increases in the future.
🗣️ Cashflow & Capital Efficiency
Effective cash flow management and capital efficiency are pivotal for sustaining dividend payments, facilitating investment in growth, and ensuring financial health.
| Year | 2024 | 2023 | 2022 |
|---|---|---|---|
| Free Cash Flow Yield | 15.27% | 14.88% | 12.41% |
| Earnings Yield | 7.51% | 7.15% | 6.81% |
| CAPEX to Operating Cash Flow | 2.87% | 1.81% | 2.05% |
| Stock-based Compensation to Revenue | 0.40% | 0.42% | 0.44% |
| Free Cash Flow / Operating Cash Flow Ratio | 97.13% | 98.19% | 97.95% |
The company's effective use of cash flows and capital efficiency measures, with consistently high free cash flow yields and low CAPEX, indicate strong financial management.
📉 Balance Sheet & Leverage Analysis
A robust balance sheet and manageable leverage are indicators of financial stability, enabling a company to weather economic challenges while continuing to pay dividends.
| Year | 2024 | 2023 | 2022 |
|---|---|---|---|
| Debt-to-Equity | 0.34 | 0.38 | 0.42 |
| Debt-to-Assets | 0.07 | 0.09 | 0.08 |
| Debt-to-Capital | 0.25 | 0.28 | 0.30 |
| Net Debt to EBITDA | 0.39 | 0.79 | 0.73 |
| Current Ratio | 48.00 | 0.43 | 83.09 |
| Quick Ratio | 48.00 | 0.43 | 385.21 |
| Financial Leverage | 4.83 | 4.41 | 5.02 |
The metrics indicate a robust balance sheet with steady leverage ratios, supporting financial stability and debt serviceability, crucial in maintaining dividend payouts.
🔍 Fundamental Strength & Profitability
Fundamental strengths and profitability are cornerstones for sustainable dividend payouts, indicating efficient operations and return on investments which enhance shareholder value.
| Year | 2024 | 2023 | 2022 |
|---|---|---|---|
| Return on Equity | 20.92% | 18.53% | 20.47% |
| Return on Assets | 4.33% | 4.20% | 4.08% |
| Net Margin | 12.88% | 11.38% | 12.37% |
| EBIT Margin | 17.53% | 15.50% | 16.57% |
| EBITDA Margin | 16.28% | 15.33% | 17.07% |
| Gross Margin | 22.89% | 22.44% | 21.83% |
| Research & Development to Revenue | 0% | 0% | 0% |
The strong return on equity and healthy profit margins depict sound financial health and operational efficiency, reinforcing its capability to sustain dividends.
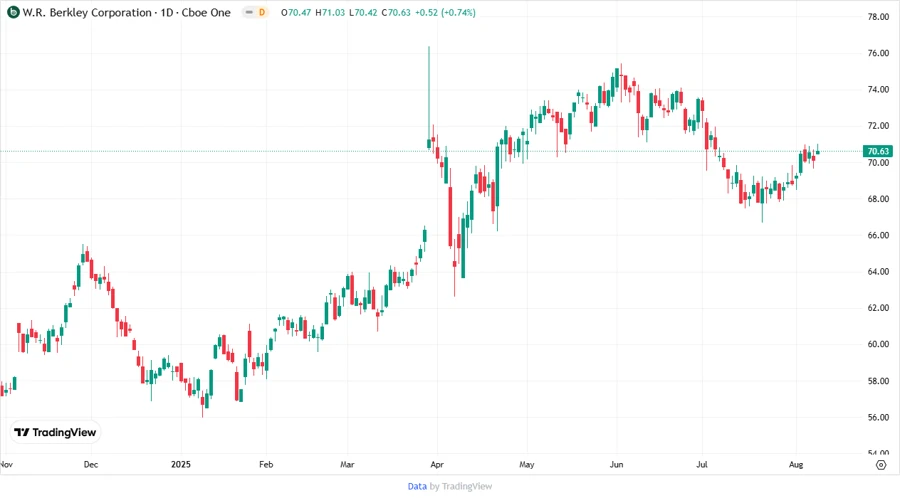
📉 Price Development
🔍 Dividend Scoring System
| Criteria | Score | Performance |
|---|---|---|
| Dividend Yield | 4 | |
| Dividend Stability | 5 | |
| Dividend Growth | 4 | |
| Payout Ratio | 5 | |
| Financial Stability | 4 | |
| Dividend Continuity | 5 | |
| Cashflow Coverage | 4 | |
| Balance Sheet Quality | 4 |
Total Score: 35/40
✅ Rating
Overall, W. R. Berkley Corporation demonstrates a commendable dividend profile with a strong focus on rewarding shareholders through consistent and growing dividends while maintaining a robust financial foundation. The corporation presents itself as an attractive investment for income-focused investors seeking sustainable returns.