July 21, 2025 a 07:31 am


WRB: Dividend Analysis - W. R. Berkley Corporation
W. R. Berkley Corporation demonstrates a strong dividend yield with steady growth over the years. The company's financial metrics indicate robust cash flow efficiency and a prudent dividend policy, laying the foundation for potential long-term returns for dividend-focused investors. With a solid history of dividend payments, W. R. Berkley is poised as a reliable choice for those seeking income consistency.
📊 Overview
The following table provides insights into the key dividend metrics and sector classification of W. R. Berkley Corporation:
| Metric | Details |
|---|---|
| Sector | Insurance |
| Dividend Yield | 2.70 % |
| Current Dividend Per Share | 1.33 USD |
| Dividend History | 40 years |
| Last Cut or Suspension | None |
🗣️ Dividend History
W. R. Berkley's resilient dividend history reflects its commitment to shareholders through consistent payouts over decades. This track record is instrumental for income investors seeking stability and predictability in their dividend income.
| Year | Dividend Per Share (USD) |
|---|---|
| 2025 | 0.67 |
| 2024 | 1.40 |
| 2023 | 1.29 |
| 2022 | 0.59 |
| 2021 | 0.89 |
📈 Dividend Growth
Dividend growth is critical as it not only signals the company's confidence in its future earnings potential but also helps investors maintain purchasing power over time. Historical growth trends provide a foundation for future projections.
| Time | Growth |
|---|---|
| 3 years | 0.16% |
| 5 years | 0.13% |
The average dividend growth is 13% over 5 years. This reflects moderate but consistent growth, supporting sustained income growth for shareholders.
⚠️ Payout Ratio
Payout ratios assess the sustainability of dividend payments by comparing them to earnings and cash flow. A prudent ratio implies the company retains sufficient earnings for growth and contingencies.
| Key Figure | Ratio |
|---|---|
| EPS-based | 30.5% |
| Free cash flow-based | 14.0% |
The EPS-based payout ratio of 30.5% and FCF-based ratio of 14.0% suggest strong coverage of the dividends from both earnings and cash flows, allowing for financial flexibility.
✅ Cashflow & Capital Efficiency
Analyzing cash flow metrics against capital efficiency highlights how effectively a company utilizes its resources. High cash flow stability ensures that dividends are well-funded from internal resources.
| 2024 | 2023 | 2022 |
|---|---|---|
| 0.15 | 0.15 | 0.12 |
| 0.08 | 0.07 | 0.07 |
| 0.02 | 0.02 | 0.02 |
| 0.97 | 0.98 | 0.98 |
With consistent free cash flow and effective capital utilization, W.R. Berkley demonstrates robust cash flow management capabilities.
🛡️ Balance Sheet & Leverage Analysis
The balance sheet provides insights into the company's leverage and liquidity. Lower leverage ratios and strong liquidity indicators reflect financial stability and reduced risk.
| 2024 | 2023 | 2022 |
|---|---|---|
| 0.34 | 0.38 | 0.42 |
| 0.07 | 0.09 | 0.08 |
| 0.25 | 0.28 | 0.30 |
| 0.53 | 0.79 | 0.73 |
| 51.52% | 0.43% | 83.09% |
| 47.97% | 0.43% | 385.21% |
| 4.83 | 4.41 | 5.02 |
Strong liquidity ratios coupled with manageable debt levels suggest sound financial positioning that supports long-term obligations and growth opportunities.
🏅 Fundamental Strength & Profitability
Profitability ratios provide insights into operational efficiency, while high returns on equity and assets are indicators of effective management strategies.
| 2024 | 2023 | 2022 |
|---|---|---|
| 0.21 | 0.19 | 0.20 |
| 0.04 | 0.04 | 0.04 |
| 0.13 | 0.11 | 0.12 |
| 1.00 | 0.72 | 0.74 |
| 0.18 | 0.15 | 0.16 |
| 0.16 | 0.15 | 0.17 |
| 0.00 | 0.00 | 0.00 |
Overall, W.R. Berkley maintains solid profitability and efficiency metrics, reinforcing investor confidence in its profit sustainability and growth prospects.
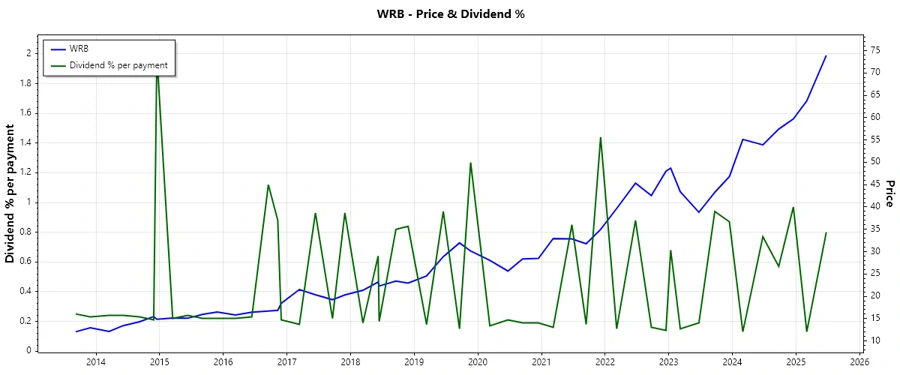
💹 Price Development
🏆 Dividend Scoring System
| Category | Score | Visualization |
|---|---|---|
| Dividend Yield | 4 | |
| Dividend Stability | 5 | |
| Dividend Growth | 3 | |
| Payout Ratio | 4 | |
| Financial Stability | 5 | |
| Dividend Continuity | 5 | |
| Cashflow Coverage | 4 | |
| Balance Sheet Quality | 5 |
Total Score: 35/40
📝 Rating
W. R. Berkley Corporation exudes strong dividend sustainability and financial health, enhancing its credibility among dividend-seeking investors. With consistent payments and growth along with robust balance sheets, the firm stands as a stalwart option for long-term investment portfolios focusing on income generation.
Smart Data Insight
Master the Perfect Entry & Exit for this Stock
Don't leave your profits to chance. Historically, this stock follows specific seasonal patterns that institutional traders use to maximize returns.
- ✅ Identify the "Golden Buying Window"
- ✅ Avoid high-risk correction cycles
- ✅ Backtested data from the last 20+ years