March 06, 2026 a 12:38 pm
WRB: Analysts Ratings - W. R. Berkley Corporation
The W. R. Berkley Corporation remains a pivotal player in the commercial lines insurance market both domestically and internationally. The company's diversified segments of Insurance and Reinsurance & Monoline Excess allow it to capture a wide range of risks, benefiting from cross-border operations.
Historical Stock Grades
Over the past months, the W. R. Berkley Corporation's stock has been predominantly rated as "Hold" by analysts, with a recent increase in "Sell" recommendations. This signals a cautious stance by analysts towards the stock's potential performance.
| Rating | Number of Ratings | Score |
|---|---|---|
| Strong Buy | 0 | |
| Buy | 3 | |
| Hold | 9 | |
| Sell | 3 | |
| Strong Sell | 2 |
Sentiment Development
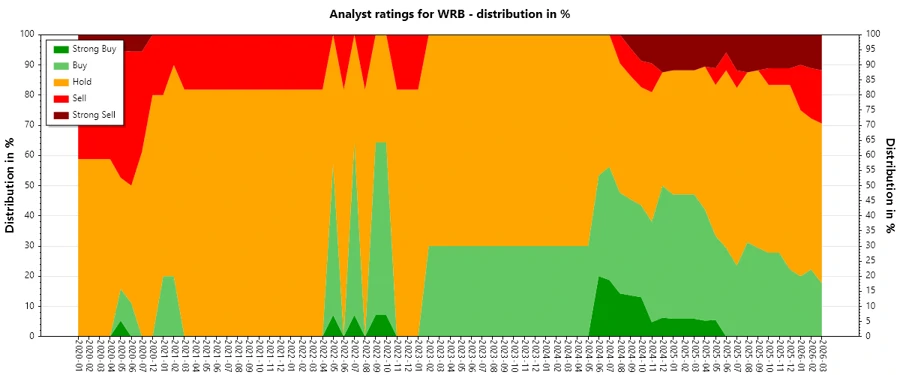
Recent data shows a noticeable shift in analyst sentiment, with a marked increase in "Hold" and "Sell" ratings over several months. The absence of "Strong Buy" ratings suggests waning bullish sentiment among analysts.
- From March 2025 to March 2026, a gradual increase in "Hold" ratings is evident.
- The share of "Buy" ratings has decreased slightly, indicating a more cautious outlook.
- Over the last year, the number of "Sell" ratings has increased, reflecting growing reservations concerning the stock's performance.
Percentage Trends
The percentage of "Hold" ratings has consistently remained high, while the proportion of "Buy" ratings has shown a declining trend. This indicates a shift towards a more neutral or bearish sentiment.
- In April 2025, "Buy" ratings comprised 35% of the total, dropping to 20% by March 2026.
- The percentage of "Hold" ratings started at 41% in October 2024 and increased to 60% by March 2026.
- Sell-oriented recommendations increased, marking analyst caution surrounding future performance.
- The rise in conservatism is apparent as analysts opt for less aggressive recommendations.
Latest Analyst Recommendations
Recent analyst recommendations for W. R. Berkley Corporation have largely maintained their prior ratings, indicating a steady view despite changing market conditions.
| Date | New Recommendation | Last Recommendation | Publisher |
|---|---|---|---|
| 2026-02-02 | Overweight | Overweight | Cantor Fitzgerald |
| 2026-02-02 | Buy | Buy | Argus Research |
| 2026-01-28 | Buy | Buy | Truist Securities |
| 2026-01-27 | Equal Weight | Equal Weight | Wells Fargo |
| 2026-01-27 | Hold | Hold | Jefferies |
Analyst Recommendations with Change of Opinion
Recommendations showing changes in opinion for W. R. Berkley reflect an evolving sentiment, with several downgrades indicating a trend towards more conservative views.
| Date | New Recommendation | Last Recommendation | Publisher |
|---|---|---|---|
| 2026-01-20 | Sell | Hold | TD Cowen |
| 2026-01-07 | Underperform | In Line | Evercore ISI Group |
| 2025-11-07 | Neutral | Buy | UBS |
| 2025-10-22 | Underperform | Market Perform | BMO Capital |
| 2025-05-22 | Neutral | Buy | Goldman Sachs |
Interpretation
The current analyst ratings for W. R. Berkley Corporation suggest a cautious market outlook, with a noticeable shift towards neutrality and conservativism among analysts. The increase in "Hold" and "Sell" ratings indicates growing uncertainty about the company's short-term prospects, while the reduction in "Buy" and "Strong Buy" ratings reflects tempered confidence. This trend could imply either market skepticism about future growth or a response to macroeconomic variables impacting the insurance industry.
Conclusion
While W. R. Berkley Corporation maintains a stable presence in the insurance market, it faces growing skepticism among analysts as inferred from the increase in neutral and negative ratings. This shift suggests heightened caution, potentially driven by market dynamics or broader economic challenges. Investors should consider these dynamics when evaluating the stock, balancing the company's strong market positioning against the current sentiment trends. As the insurance sector navigates economic fluctuations, maintaining agility and proactive risk management will be critical for W. R. Berkley to harness potential growth opportunities and mitigate risks.
Smart Data Insight
Master the Perfect Entry & Exit for this Stock
Don't leave your profits to chance. Historically, this stock follows specific seasonal patterns that institutional traders use to maximize returns.
- ✅ Identify the "Golden Buying Window"
- ✅ Avoid high-risk correction cycles
- ✅ Backtested data from the last 20+ years