
October 06, 2025 a 05:16 am
WM: Fibonacci Analysis - Waste Management, Inc.
Waste Management, Inc. has consistently shown resilience in its stock performance, primarily due to its expansive operational footprint in North America and diverse range of environmental services. Recently, the company experienced a bearish trend but has shown signs of recovery. Technical indicators suggest potential buying opportunities, especially if the stock maintains key support levels.
Fibonacci Analysis
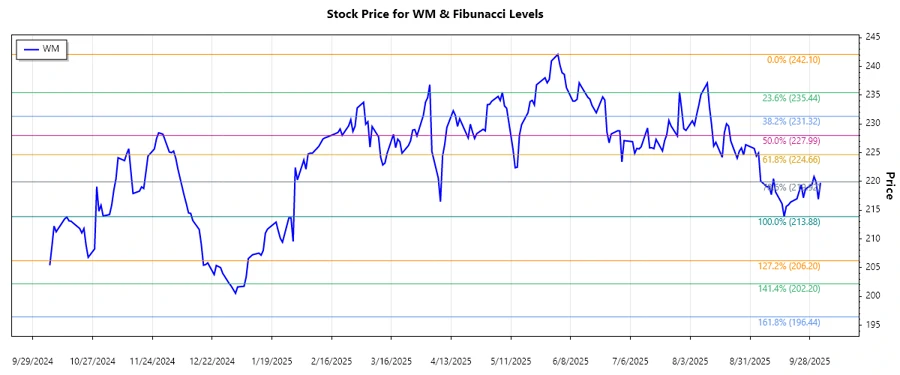
Based on the historical data, Waste Management, Inc. (ticker: WM) experienced a significant downtrend over the past few months. The analysis below includes crucial Fibonacci retracement levels derived from the high and low points during this trend.
| Detail | Information |
|---|---|
| Trend Start Date | 2025-06-02 |
| Trend End Date | 2025-10-03 |
| High Price | $242.10 (2025-06-02) |
| Low Price | $213.88 (2025-09-16) |
| Fibonacci Level | Price Level |
|---|---|
| 0.236 | $219.13 |
| 0.382 | $224.83 |
| 0.5 | $227.99 |
| 0.618 | $231.15 |
| 0.786 | $236.27 |
The current price of $219.76 sits near the 0.236 retracement level, indicating possible support at this range. If this holds, it could suggest a reversal or a stabilization of recent declines. If it breaks, further downside is possible.
Conclusion
Waste Management, Inc.'s stock has undergone a correction from its previous highs, but now shows signs of holding important technical retracements. While a move above $227.99 could indicate renewed momentum, a fall below $213.88 would signify further weakness. Market conditions and operational advancements will play critical roles in future price movements. Analysts should monitor trends closely, as economic conditions impacting waste management and environmental sectors could have lasting effects on the stock's trajectory.
Smart Data Insight
Master the Perfect Entry & Exit for this Stock
Don't leave your profits to chance. Historically, this stock follows specific seasonal patterns that institutional traders use to maximize returns.
- ✅ Identify the "Golden Buying Window"
- ✅ Avoid high-risk correction cycles
- ✅ Backtested data from the last 20+ years