
July 16, 2026 a 07:46 am
WM: Dividend Analysis - Waste Management, Inc.
Waste Management, Inc., a leader in environmental services, demonstrates a strong commitment to shareholder returns through consistent dividend payments. With a market presence reflected in its substantial market capitalization, WM has a respectable dividend yield and a solid history of dividend stability. Investors can view the company as a reliable income-generating stock, given its track record in dividend growth and stability.
📊 Overview
Waste Management operates within the Environmental Services sector and prides itself on providing dependable dividends over the years. The company's dividend profile exemplifies its commitment to stable payouts, reflecting positively in its admirable yield and consistent dividend history.
| Aspect | Details |
|---|---|
| Sector | Environmental Services |
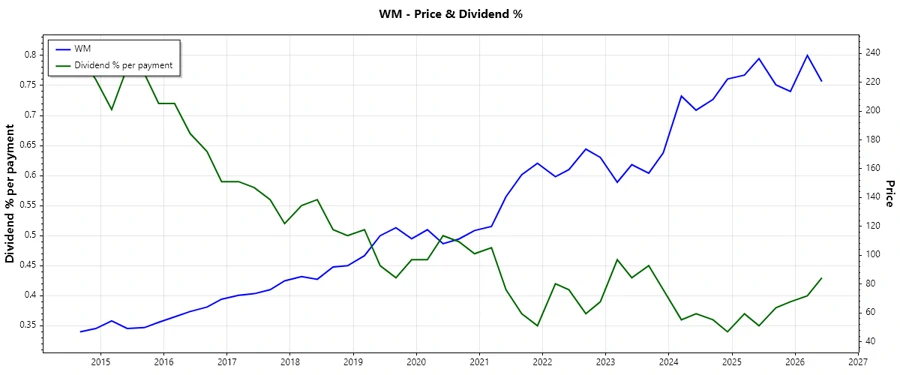
| Dividend Yield | 1.61% |
| Current Dividend Per Share | $3.31 |
| Dividend History | 29 years |
| Last Cut or Suspension | None |
🗣️ Dividend History
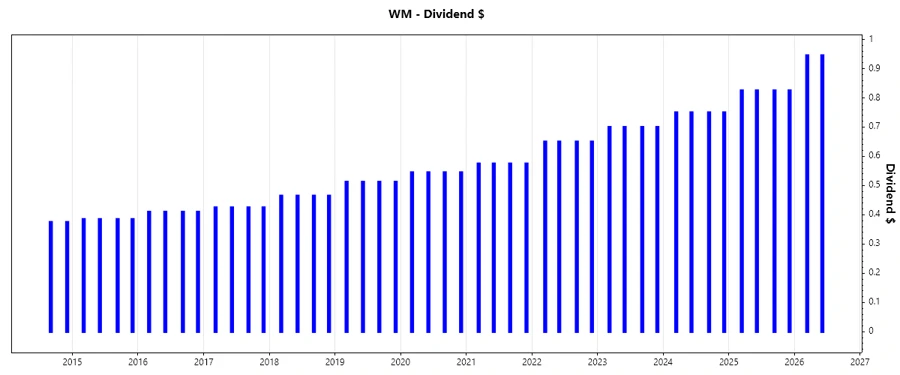
Analyzing dividend history is crucial for evaluating a company's commitment to rewarding its shareholders. WM’s consistent dividend growth despite market volatility showcases a strong financial foundation.
| Year | Dividend Per Share (USD) |
|---|---|
| 2026 | $1.89 |
| 2025 | $3.30 |
| 2024 | $3.00 |
| 2023 | $2.80 |
| 2022 | $2.60 |
📈 Dividend Growth
Dividend growth highlights a company’s ability to increase shareholder returns. WM’s growth indicates robust financial health and effective strategic management.
| Time | Growth |
|---|---|
| 3 years | 8.27% |
| 5 years | 8.65% |
The average dividend growth is 8.65% over 5 years. This shows moderate but steady dividend growth.
✅ Payout Ratio
Payout ratios offer insight into the sustainability of dividends relative to earnings and cash flow. A balanced payout ratio suggests prudent financial management.
| Key Figure | Ratio |
|---|---|
| EPS-based | 47.80% |
| Free Cash Flow-based | 40.43% |
The EPS-based payout ratio of 47.80% and FCF-based ratio of 40.43% indicate a conservatively managed dividend policy, allowing for growth and reinvestment opportunities.
⚖️ Cashflow & Capital Efficiency
Evaluating cash flow effectiveness and capital efficiency is critical for assessing how well a company utilizes its resources. WM showcases adequate cashflow management and capital use.
| Metric/Year | 2023 | 2024 | 2025 |
|---|---|---|---|
| Free Cash Flow Yield | 3.52% | 2.66% | 3.18% |
| Earnings Yield | 2.98% | 3.39% | 3.06% |
| CAPEX to Operating Cash Flow | 48.07% | 59.94% | 53.40% |
| Stock-based Compensation to Revenue | -0.19% | 0.53% | 0% |
| Free Cash Flow / Operating Cash Flow Ratio | 46.60% | 40.06% | 46.60% |
| Return on Invested Capital | 9.21% | 8.30% | 8.88% |
WM's cashflow and capital efficiency metrics exhibit robust operational control and resource allocation.
🔍 Balance Sheet & Leverage Analysis
Assessment of balance sheet health and leverage is crucial in determining a company's long-term financial stability. WM's leverage ratios suggest a moderately leveraged profile necessitating close monitoring.
| Metric/Year | 2023 | 2024 | 2025 |
|---|---|---|---|
| Debt-to-Equity | 2.35 | 2.90 | 2.29 |
| Debt-to-Assets | 49.44% | 53.63% | 49.98% |
| Debt-to-Capital | 70.16% | 74.33% | 69.63% |
| Net Debt to EBITDA | 2.76 | 3.64 | 3.15 |
| Current Ratio | 0.90 | 0.76 | 0.89 |
| Quick Ratio | 0.86 | 0.73 | 0.85 |
| Financial Leverage | 4.75 | 5.40 | 4.59 |
WM's balance sheet shows resilience with responsible leverage ratios, but the company should aim to enhance liquidity and reduce financial leverage.
💪 Fundamental Strength & Profitability
Analyzing fundamental performance and profitability ratios is vital for evaluating core business efficacy. WM shows strong profitability and investment returns.
| Metric/Year | 2023 | 2024 | 2025 |
|---|---|---|---|
| Return on Equity | 33.38% | 33.28% | 27.11% |
| Return on Assets | 7.02% | 6.16% | 5.91% |
| Net Margin | 11.28% | 12.45% | 10.74% |
| EBIT Margin | 17.24% | 18.38% | 17.21% |
| EBITDA Margin | 28.01% | 29.26% | 28.57% |
| Gross Margin | 28.15% | 29.07% | 29.08% |
| R&D to Revenue | 0% | 0% | 0% |
WM's profitability metrics reflect solid performance and significant value generation, underpinning its capability to sustain and grow dividends.
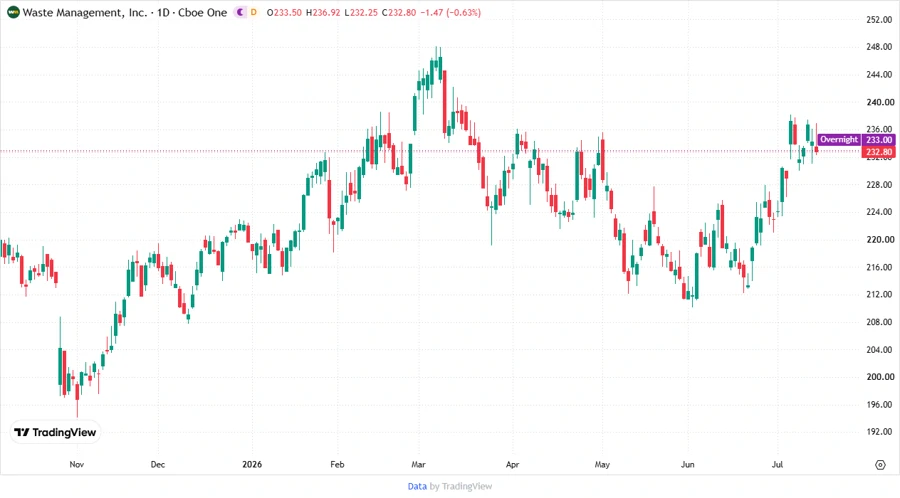
📉 Price Development
🎯 Dividend Scoring System
| Criterion | Score | |
|---|---|---|
| Dividend Yield | 3 | |
| Dividend Stability | 4 | |
| Dividend Growth | 4 | |
| Payout Ratio | 3 | |
| Financial Stability | 3 | |
| Dividend Continuity | 5 | |
| Cashflow Coverage | 3 | |
| Balance Sheet Quality | 3 |
Total Score: 28/40
🌟 Rating
Based on its financial metrics, Waste Management, Inc. stands as a stable choice for dividend investors, exhibiting reliable payouts with substantial growth potential. While its balance sheet shows some leverage, the company's overall financial health, reinforced by its profitability metrics, suggests it can continue to meet shareholder expectations. It is advisable for investors seeking consistent dividends with growth opportunities to consider WM as part of their portfolio.
Smart Data Insight
Master the Perfect Entry & Exit for this Stock
Don't leave your profits to chance. Historically, this stock follows specific seasonal patterns that institutional traders use to maximize returns.
- ✅ Identify the "Golden Buying Window"
- ✅ Avoid high-risk correction cycles
- ✅ Backtested data from the last 20+ years