
July 14, 2026 a 07:31 am
WM: Dividend Analysis - Waste Management, Inc.
Waste Management, Inc. demonstrates a strong dividend profile with a consistent payment history extending over 29 years. The company's commitment to maintaining and growing its dividend is reflected in its strategic financial management and resilience in various market conditions. The current dividend yield, while moderate, is underpinned by a dependable earnings flow and a dedicated policy to return value to shareholders. Overall, Waste Management presents a stable investment opportunity for income-focused portfolios.
📊 Overview
The company's consistent performance is embodied in its admirable dividend history. As part of the Industrial sector, Waste Management maintains a moderate dividend yield of 1.61%. The current dividend per share is $3.31, supported by a dividend history that spans 29 years. Impressively, there have been no recent cuts or suspensions, a testament to the company's robust financial health.
| Metric | Detail |
|---|---|
| Sector | Industrial |
| Dividend yield | 1.61% |
| Current dividend per share | $3.31 |
| Dividend history | 29 years |
| Last cut or suspension | None |
🗣️ Dividend History
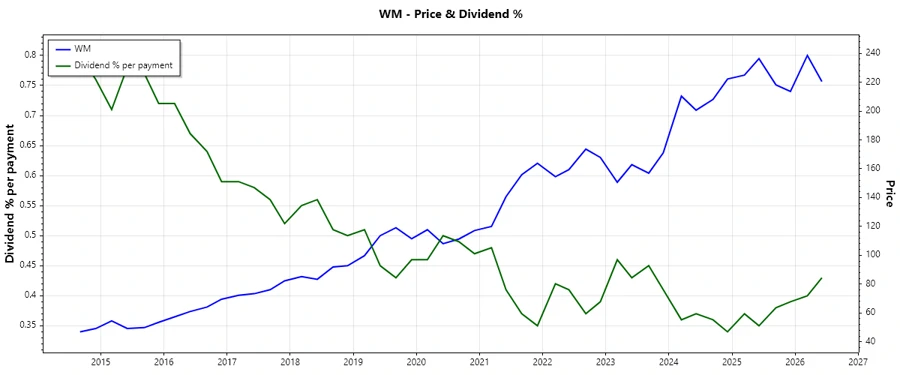
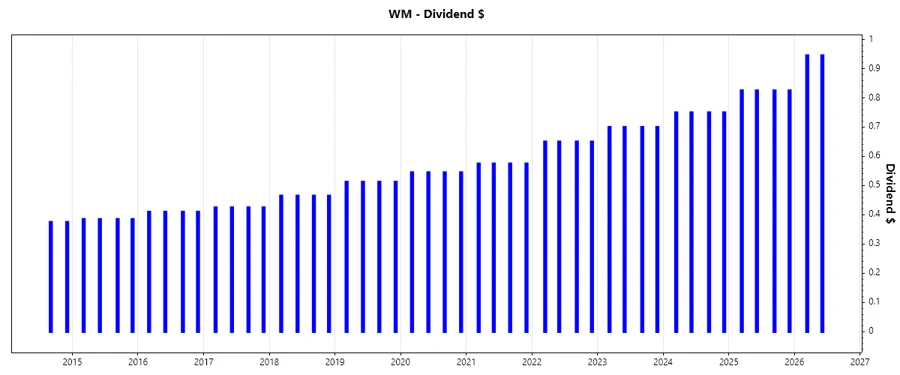
Waste Management's dividend history underscores its financial resilience and commitment to shareholder returns. The consistency over 29 years indicates strong cash generation and operational stability. A stable dividend history is crucial as it builds investor confidence and reflects the firm's ability to navigate economic downturns.
| Year | Dividend per Share (USD) |
|---|---|
| 2026 | 1.890 |
| 2025 | 3.300 |
| 2024 | 3.00 |
| 2023 | 2.8 |
| 2022 | 2.60 |
📈 Dividend Growth
The dividend growth metric is essential for assessing a company's future yield potential. Waste Management's dividend growth over the past 3 and 5 years reflects a positive trend, albeit at a modest rate. This indicates an increase in the company's profitability and a stable financial position, essential for long-term value.
| Time | Growth |
|---|---|
| 3 years | 8.27% |
| 5 years | 8.65% |
The average dividend growth is 8.65% over 5 years. This shows moderate but steady dividend growth.
⚖️ Payout Ratio
The payout ratio evaluates the sustainability of a company's dividend relative to its earnings. At 47.80% EPS and 40.43% FCF, Waste Management maintains a healthy cushion in its payout practices, ensuring dividends are well-supported by profits and cash flow. This prudent approach underlines its commitment to responsible financial management.
| Key Figure | Ratio |
|---|---|
| EPS-based | 47.80% |
| Free cash flow-based | 40.43% |
💰 Cashflow & Capital Efficiency
The cash flow and capital efficiency metrics provide insights into how effectively a company generates and utilizes its cash. These figures illustrate Waste Management’s capability to cover dividends with operational cash while efficiently allocating capital towards growth and operational expenditures.
| Metric | 2025 | 2024 | 2023 |
|---|---|---|---|
| Free Cash Flow Yield | 3.18% | 2.66% | 2.52% |
| Earnings Yield | 3.06% | 3.39% | 3.17% |
| CAPEX to Operating Cash Flow | 48.07% | 59.94% | 61.35% |
| Stock-based Compensation to Revenue | -0.19% | 0.53% | 0.45% |
| Free Cash Flow / Operating Cash Flow Ratio | 46.60% | 40.06% | 38.65% |
🔍 Balance Sheet & Leverage Analysis
Insights into financial stability and leverage are essential to understand a company's ability to manage debts and meet long-term obligations. Waste Management's leverage ratios depict a heavily leveraged position, which may affect flexibility but reflects strategic capital use.
| Metric | 2025 | 2024 | 2023 |
|---|---|---|---|
| Debt-to-Equity | 2.29 | 2.90 | 2.35 |
| Debt-to-Assets | 0.50 | 0.54 | 0.49 |
| Debt-to-Capital | 0.69 | 0.74 | 0.70 |
| Net Debt to EBITDA | 3.15 | 3.64 | 2.76 |
| Current Ratio | 0.89 | 0.76 | 0.90 |
| Quick Ratio | 0.85 | 0.73 | 0.86 |
| Financial Leverage | 4.59 | 5.40 | 4.75 |
📈 Fundamental Strength & Profitability
Examining profitability and fundamental strength provides a window into a company's ability to generate earnings from its assets and equity. Waste Management exhibits robust profitability metrics, underlining a well-executed business model and efficient asset utilization.
| Metric | 2025 | 2024 | 2023 |
|---|---|---|---|
| Return on Equity | 27.11% | 33.28% | 33.38% |
| Return on Assets | 5.91% | 6.16% | 7.02% |
| Margins: Net | 10.74% | 12.45% | 11.28% |
| Margins: EBIT | 17.21% | 18.38% | 17.24% |
| Margins: EBITDA | 28.57% | 29.26% | 28.01% |
| Margins: Gross | 29.08% | 29.07% | 28.15% |
| R&D to Revenue | 0.00% | 0.00% | 0.00% |
📉 Price Development
✅ Dividend Scoring System
| Criteria | Score | Score Bar |
|---|---|---|
| Dividend yield | 3 | |
| Dividend Stability | 5 | |
| Dividend growth | 4 | |
| Payout ratio | 4 | |
| Financial stability | 3 | |
| Dividend continuity | 5 | |
| Cashflow Coverage | 4 | |
| Balance Sheet Quality | 3 |
Total Score: 31 out of 40
Rating
Waste Management, Inc. is a strong contender for income-producing portfolios. Its high dividend continuity score, combined with stable financial foundations, ensures reliable and growing dividend payouts. Despite a seasoned leverage position, its fiscal strategies safeguard shareholder returns. Overall, a dependable investment choice.
Smart Data Insight
Master the Perfect Entry & Exit for this Stock
Don't leave your profits to chance. Historically, this stock follows specific seasonal patterns that institutional traders use to maximize returns.
- ✅ Identify the "Golden Buying Window"
- ✅ Avoid high-risk correction cycles
- ✅ Backtested data from the last 20+ years