
May 25, 2026 a 03:31 pm

📊 WM: Dividend Analysis - Waste Management, Inc.
Waste Management, Inc., with a substantial history of reliable dividend payments, presents a solid profile for dividend investors. The company's dividends are sustained by robust financial metrics, ensuring continuity and moderate growth. However, investors should remain aware of the slightly average growth rates and evaluate it against market alternatives.
🗣️ Overview
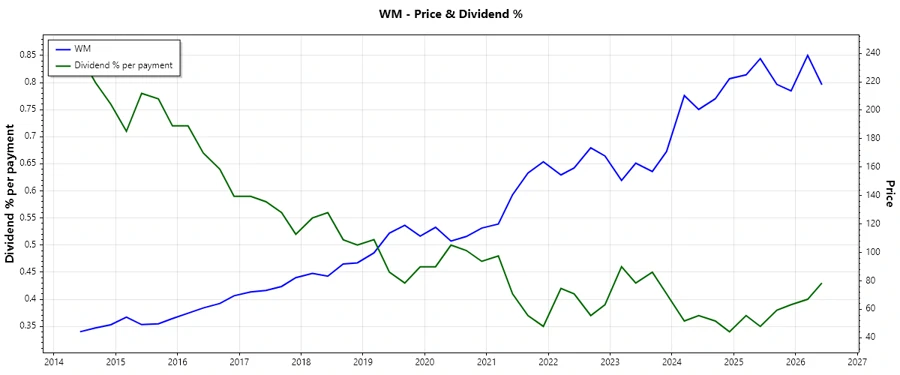
The sector in which Waste Management, Inc. operates influences its ability to maintain and potentially grow its dividends. With a dividend yield of 1.62%, the company offers a steady return in the form of dividends. A current dividend per share of $3.31, upheld over 29 consecutive years, demonstrates a strong commitment to shareholder returns. The absence of recent dividend cuts or suspensions suggests financial stability and foresight in managing corporate resources.
| Key Metric | Details |
|---|---|
| Sector | Industrial Services |
| Dividend Yield | 1.62% |
| Current Dividend Per Share | $3.31 |
| Dividend History | 29 years |
| Last Cut or Suspension | None |
📈 Dividend History
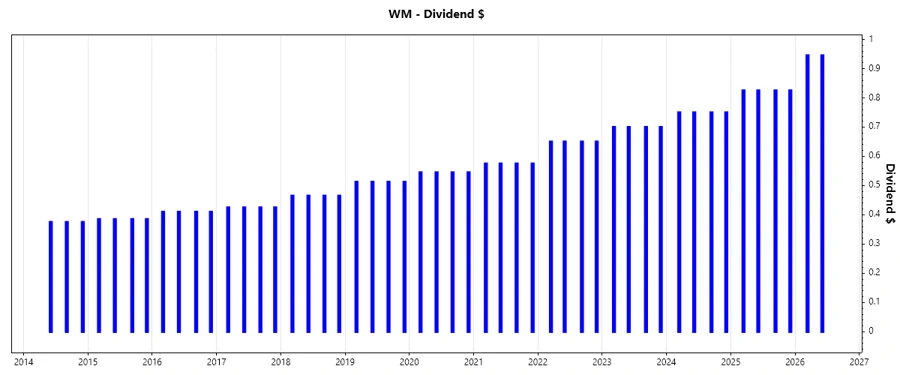
The historical dividend payments exemplify the firm's resilience and commitment to its dividend strategy. Five consecutive annual increases solidify confidence in the company's financial framework to support consistent payouts.
| Year | Dividend Per Share (USD) |
|---|---|
| 2026 | 1.890 |
| 2025 | 3.300 |
| 2024 | 3.000 |
| 2023 | 2.800 |
| 2022 | 2.600 |
📈 Dividend Growth
Dividend growth percentages reveal the firm's potential for increasing shareholder value. Over three years, an average growth rate of 8.27% has been achieved, slightly increasing over a five-year period to 8.65%. This moderate expansion is exemplary of a stable but gradual growth strategy aimed at steady shareholder returns.
| Time | Growth |
|---|---|
| 3 years | 8.27% |
| 5 years | 8.65% |
The average dividend growth is 8.65% over 5 years. This shows moderate but steady dividend growth.
✅ Payout Ratio
The payout ratio denotes the portion of earnings and free cash flow used for dividends. With an EPS payout of 47.80% and FCF payout at 40.43%, Waste Management prudently balances reinvestment with rewarding its investors, ensuring fiscal elasticity to buffer future economic uncertainties.
| Key Figure | Ratio |
|---|---|
| EPS-based | 47.80% |
| Free Cash Flow-based | 40.43% |
These payout ratios reflect a strong capability to sustain dividend levels without jeopardizing internal growth initiatives or expansion plans.
⚖️ Cashflow & Capital Efficiency
Robust cash flow and capital management ensure the sustenance and enlargement of dividends. Key metrics such as the Free Cash Flow / Operating Cash Flow ratio of 46.60% suggest competent capital utilization and allocation processes. While CAPEX to Operating Cash Flow is at 48.07%, the company's investments in operational expansions are efficient and strategic. Stock-based compensation remains negligible against revenue, emphasizing a focus on core operational efficiencies.
| Metric | 2025 | 2024 | 2023 |
|---|---|---|---|
| Free Cash Flow Yield | 3.18% | 2.66% | 2.52% |
| Earnings Yield | 3.06% | 3.39% | 3.18% |
| CAPEX to Operating Cash Flow | 53.40% | 59.94% | 61.35% |
| Stock-based Compensation to Revenue | 0% | 0.53% | 0.46% |
| Free Cash Flow / Operating Cash Flow | 46.60% | 40.06% | 38.65% |
The indicators of cash flow stability and capital efficiency reflect a well-configured financial strategy to sustain dividends and reinvest in revenue-generating avenues.
📊 Balance Sheet & Leverage Analysis
A thorough analysis of leverage ratios indicates the company's approach to debt management and its impact on financial stability. The Debt to Equity ratio and the Net Debt to EBITDA ratio signal a controlled leverage strategy, essential for maintaining dividend payouts amidst variable market conditions.
| Metric | 2025 | 2024 | 2023 |
|---|---|---|---|
| Debt-to-Equity | 2.29 | 2.90 | 2.35 |
| Debt-to-Assets | 49.98% | 53.63% | 49.44% |
| Debt-to-Capital | 69.63% | 74.33% | 70.16% |
| Net Debt to EBITDA | 3.15 | 3.64 | 2.76 |
| Current Ratio | 0.89 | 0.76 | 0.90 |
| Quick Ratio | 0.89 | 0.73 | 0.86 |
| Financial Leverage | 4.59 | 5.40 | 4.75 |
Waste Management's balance sheet structure is solid, with an emphasis on maintaining sustainable leverage and liquidity to reinforce dividend policies.
📉 Fundamental Strength & Profitability
Evaluating profitability metrics like ROE and ROA helps gauge fundamental strength. The company's margins indicate operational proficiency, high asset utilizations, and efficient shareholder returns—key indicators of sustaining and enhancing shareholder value.
| Metric | 2025 | 2024 | 2023 |
|---|---|---|---|
| Return on Equity | 27.11% | 33.28% | 33.38% |
| Return on Assets | 5.91% | 6.16% | 7.02% |
| Net Margin | 10.74% | 12.45% | 11.28% |
| EBIT Margin | 17.21% | 18.38% | 17.24% |
| EBITDA Margin | 28.57% | 29.26% | 28.01% |
| Gross Margin | 29.08% | 29.07% | 28.15% |
| R&D to Revenue | 0% | 0% | 0% |
The profitability ratios, particularly ROE and firm margins, signify a robust financial foundation underpinning dividend commitments.
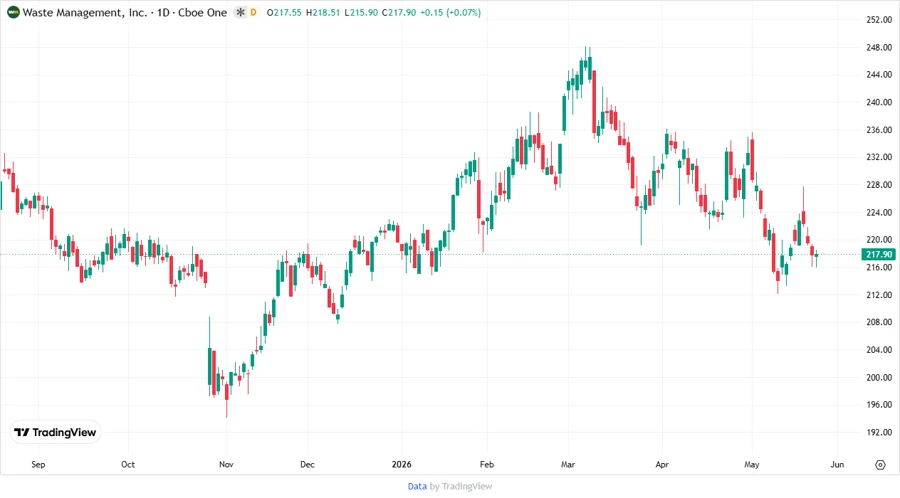
🤑 Price Development
🌟 Dividend Scoring System
| Criteria | Score | Visual Score |
|---|---|---|
| Dividend Yield | 3 | |
| Dividend Stability | 5 | |
| Dividend Growth | 3 | |
| Payout Ratio | 4 | |
| Financial Stability | 4 | |
| Dividend Continuity | 5 | |
| Cashflow Coverage | 4 | |
| Balance Sheet Quality | 4 |
Total Score: 32/40
🔍 Rating
Waste Management, Inc. receives a high dividend score, highlighted by stability and financial strength. The company is well-positioned to continue delivering significant shareholder value through its sustainable dividend policies. It's a strong candidate for income-oriented portfolios seeking dependable dividend returns.
Smart Data Insight
Master the Perfect Entry & Exit for this Stock
Don't leave your profits to chance. Historically, this stock follows specific seasonal patterns that institutional traders use to maximize returns.
- ✅ Identify the "Golden Buying Window"
- ✅ Avoid high-risk correction cycles
- ✅ Backtested data from the last 20+ years