May 24, 2026 a 12:46 pm
WM: Dividend Analysis - Waste Management, Inc.
Waste Management, Inc. demonstrates a consistent dividend payment history with a commendable track record of maintaining dividend distributions over the years. While the current dividend yield is relatively moderate at 1.62%, the company boasts a strong history of dividend stability and growth. Their payout ratios suggest sustainable dividend levels aligned with earnings and cash flow generation, making this stock a reliable choice for dividend-focused investors.
📊 Overview
The fundamentals of Waste Management, Inc. underscore its resilience in the market, showcasing substantial sector leadership. The company's long-term dividend issuance accentuates a robust shareholder commitment with the following key metrics:
| Metric | Value |
|---|---|
| Sector | Environmental Services |
| Dividend Yield | 1.62% |
| Current Dividend Per Share | $3.31 |
| Dividend History | 29 years |
| Last Cut or Suspension | None |
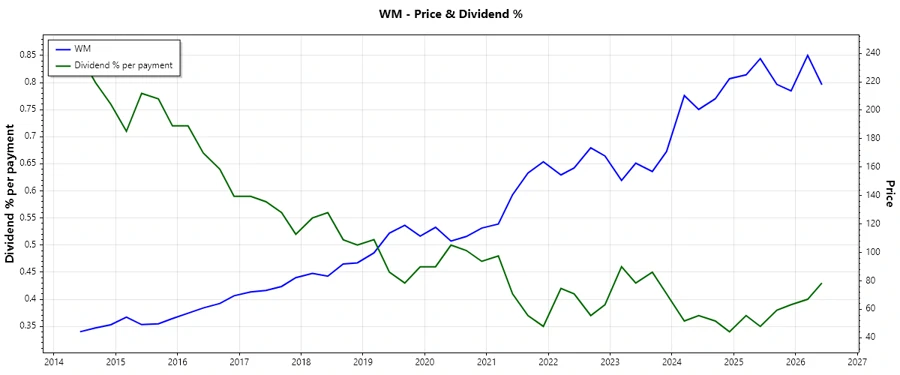
📈 Dividend History
The historical analysis emphasizes Waste Management, Inc.'s substantial commitment to returning value to shareholders. Sustaining a dividend for 29 years reinforces its reputation for reliability in income returns, crucial for investors seeking income stability.
| Year | Dividend Per Share |
|---|---|
| 2026 | $1.890 |
| 2025 | $3.300 |
| 2024 | $3.00 |
| 2023 | $2.80 |
| 2022 | $2.60 |
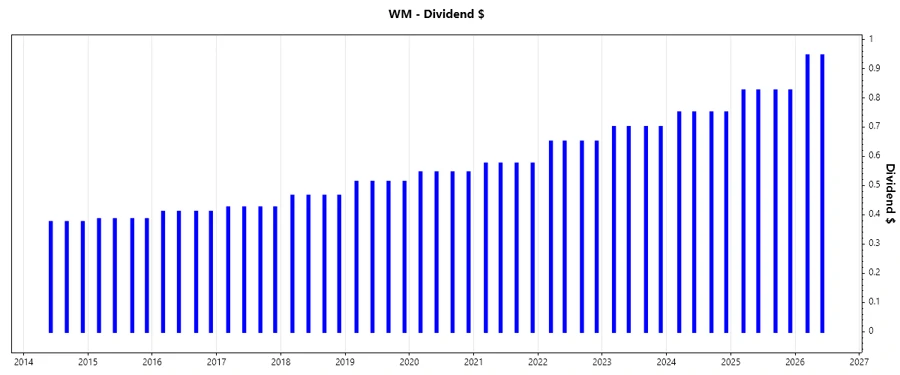
📉 Dividend Growth
The measurement of dividend growth portrays a consistent enhancement in shareholder value, validating the company's sustainable growth strategies. Highlighting both the three and five-year CAGR, it presents Waste Management, Inc. as a growing dividend entity.
| Time | Growth |
|---|---|
| 3 years | 8.27% |
| 5 years | 8.65% |
The average dividend growth is 8.65% over 5 years. This shows moderate but steady dividend growth.
✅ Payout Ratio
An analysis of payout ratios is vital to understanding the sustainability of dividend payments. The balance between cash flows and earnings signifies how well the company can distribute profits back to its shareholders.
| Key Figure | Ratio |
|---|---|
| EPS-based | 47.80% |
| Free cash flow-based | 40.43% |
The EPS-based payout ratio at 47.80% coupled with a free cash flow payout of 40.43% suggests a solid dividend coverage, indicating the company's capability to sustain its dividend distributions without financial strain.
💡 Cashflow & Capital Efficiency
Waste Management's cash flow and capital utilization reflect its operational dexterity. Evaluating these metrics provides insight into the firm's ability to efficiently deploy capital for continued growth and shareholder value enhancement.
| Year | 2025 | 2024 | 2023 |
|---|---|---|---|
| Free Cash Flow Yield | 3.18% | 2.66% | 2.52% |
| Earnings Yield | 3.06% | 3.39% | 3.17% |
| CAPEX to Operating Cash Flow | 53.40% | 59.94% | 61.35% |
| Stock-based Compensation to Revenue | 0% | 0.53% | 0.45% |
| Free Cash Flow / Operating Cash Flow Ratio | 46.59% | 40.06% | 38.65% |
The analysis of cash flow stability combined with capital efficiency metrics suggests a proficient handling of capital investments, supporting sustained growth and shareholder returns.
📊 Balance Sheet & Leverage Analysis
Understanding Waste Management's leverage and liquidity positions is quintessential in assessing financial risks and structure. Such analysis assists in evaluating the company's ability to meet financial obligations.
| Year | 2025 | 2024 | 2023 |
|---|---|---|---|
| Debt-to-Equity Ratio | 2.29 | 2.89 | 2.35 |
| Debt-to-Assets Ratio | 49.98% | 53.63% | 49.44% |
| Debt-to-Capital Ratio | 69.63% | 74.33% | 70.16% |
| Net Debt to EBITDA | 3.15 | 3.64 | 2.76 |
| Current Ratio | 0.94 | 0.76 | 0.90 |
| Quick Ratio | 0.89 | 0.73 | 0.86 |
| Financial Leverage | 4.59 | 5.40 | 4.75 |
These leverage metrics suggest Waste Management’s strategic use of debt to fund operations and growth while maintaining adequate liquidity to support short-term financial commitments.
🔍 Fundamental Strength & Profitability
Analyzing the core profitability of Waste Management is pivotal. It provides insight into its operational efficacy and the ability to leverage assets for optimal returns, crucial for value-driven investors.
| Year | 2025 | 2024 | 2023 |
|---|---|---|---|
| Return on Equity | 27.11% | 33.28% | 33.38% |
| Return on Assets | 5.91% | 6.16% | 7.02% |
| Net Profit Margin | 10.74% | 12.45% | 11.28% |
| EBIT Margin | 17.21% | 18.38% | 17.24% |
| EBITDA Margin | 28.57% | 29.26% | 28.01% |
Waste Management's profitability margins signify a robust operational framework, demonstrating effective cost management and scalable returns to investors.
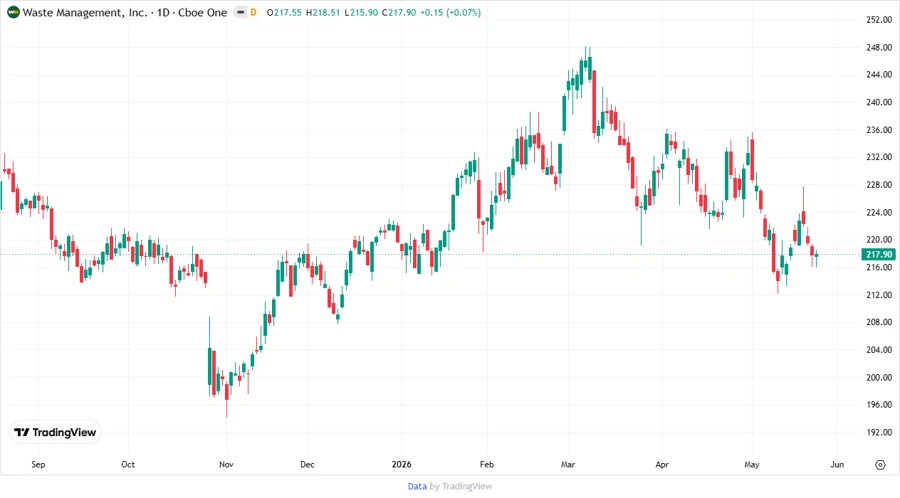
📈 Price Development
🌟 Dividend Scoring System
| Criteria | Score | |
|---|---|---|
| Dividend Yield | 3 | |
| Dividend Stability | 5 | |
| Dividend Growth | 4 | |
| Payout Ratio | 4 | |
| Financial Stability | 4 | |
| Dividend Continuity | 5 | |
| Cashflow Coverage | 4 | |
| Balance Sheet Quality | 4 |
Overall Score: 33 out of 40
🗣️ Rating
Waste Management, Inc. earns a strong recommendation as an income-generating asset. The company's consistent dividend history, manageable payout ratios, and operational stability offer a balanced investment with solid dividend prospects. This reliability makes it an appealing choice for long-term dividend growth and income-focused investors.
Smart Data Insight
Master the Perfect Entry & Exit for this Stock
Don't leave your profits to chance. Historically, this stock follows specific seasonal patterns that institutional traders use to maximize returns.
- ✅ Identify the "Golden Buying Window"
- ✅ Avoid high-risk correction cycles
- ✅ Backtested data from the last 20+ years