February 23, 2026 a 03:15 am

WMT: Trend and Support & Resistance Analysis - Walmart Inc.
The Walmart stock, traded under the ticker WMT, is known for its resilience in shifting market conditions. Over recent months, the stock has displayed a dynamic range of movements influenced by various factors inclusive of retail market trends and corporate strategies. This analysis delves into the technical aspects, identifying trends and critical support and resistance zones. Investors are advised to carefully monitor these technical indicators to make informed decisions.
Trend Analysis
| Date | Closing Price | Trend |
|---|---|---|
| 2026-02-20 | $122.99 | ▼ Downtrend |
| 2026-02-19 | $124.87 | ▲ Uptrend |
| 2026-02-18 | $126.62 | ▲ Uptrend |
| 2026-02-17 | $128.85 | ▲ Uptrend |
| 2026-02-13 | $133.89 | ▲ Uptrend |
| 2026-02-12 | $133.64 | ▲ Uptrend |
| 2026-02-11 | $128.77 | ⚖️ Sideways |
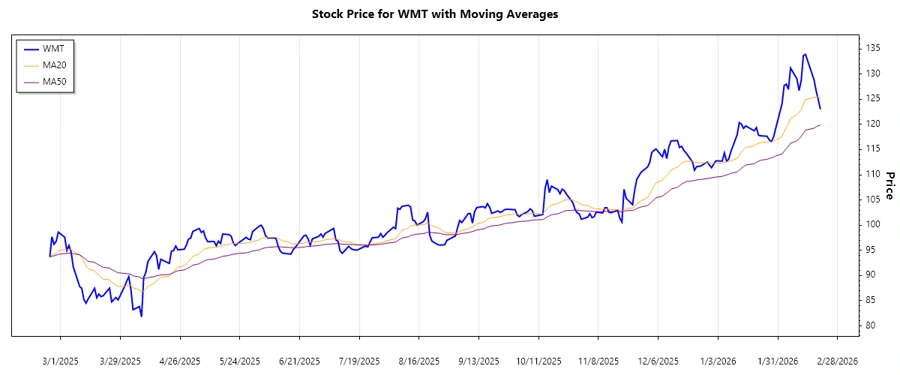
Recently the Walmart Inc. stock has been in an uptrend as the EMA20 surpasses the EMA50, indicating strong bullish activity. However, investors should keep an eye on market conditions that might lead to reversals.
Support- and Resistance
| Zone Type | Range |
|---|---|
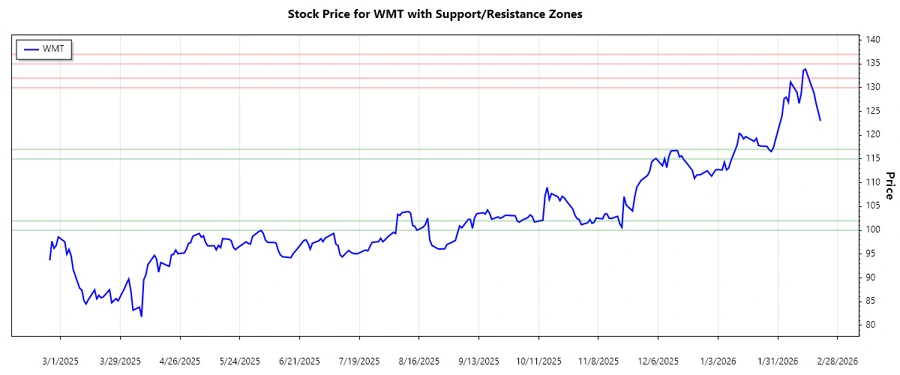
| Support Zone 1 | ▲ $115.00 - $117.00 |
| Support Zone 2 | ▲ $100.00 - $102.00 |
| Resistance Zone 1 | ▼ $130.00 - $132.00 |
| Resistance Zone 2 | ▼ $135.00 - $137.00 |
Currently, the stock is hovering near a potential resistance zone which could lead to a temporary shift in trend dynamics if it fails to break through.
Conclusion
Walmart Inc. stock demonstrates a resilient uptrend, yet looms near significant resistance zones. This upward trajectory offers promising prospects for bullish investors, while caution is advised should the stock encounter formidable resistance. Monitoring market developments and adjusting strategies accordingly is recommended for mitigating potential risks associated with sudden trend reversals.