May 13, 2026 a 03:15 pm

WMT: Fibonacci Analysis - Walmart Inc.
Walmart Inc.’s stock has shown significant growth over the analysed period, with an emerging pattern leaning towards a bullish trend. This growth is largely supported by the company's robust eCommerce strategies and diversified product lines. Investors have shown increased confidence, reflecting in the stock price driven by consistent performance in multiple segments including international markets and digital platforms. However, as with any stock, external market factors could impact future performance.
Fibonacci Analysis
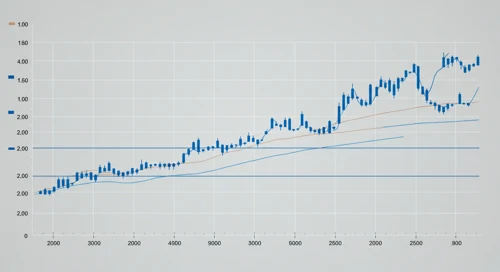
Based on the historical data from November 11, 2025, to May 13, 2026, WMT shares followed an upward trend. The analysis identified a high of $133.89 on February 13, 2026, and a low of $100.61 on November 19, 2025. Using these pivotal points, the following Fibonacci retracement levels were calculated:
| Level | Price |
|---|---|
| 0.236 | $107.87 |
| 0.382 | $113.17 |
| 0.5 | $117.25 |
| 0.618 | $121.33 |
| 0.786 | $126.06 |
As of the last data point, the current price of WMT is $130.26, which is above the 0.786 retracement level. The current position suggests the stock is not in any retracement zone and continues to exhibit strong momentum.
Technically, this suggests potential support for the current upward trend, although attention should be paid to any signals of weakening momentum which could imply it may consolidate or correct back towards lower Fibonacci levels.
Conclusion
Walmart Inc’s stock continues to demonstrate solid upward movement, indicative of the company’s robust operational strategies and market position. The strong presence in digital trends and diverse product offerings provides a cushion against market volatilities, though investors should remain cautious of macroeconomic uncertainties. As the stock sits above significant retracement levels, opportunities for further upside exist but need validation through continuous market trends and investor sentiment. Analysts should closely monitor earnings reports and industry news for any potential impacts on future stock performance.
Smart Data Insight
Master the Perfect Entry & Exit for this Stock
Don't leave your profits to chance. Historically, this stock follows specific seasonal patterns that institutional traders use to maximize returns.
- ✅ Identify the "Golden Buying Window"
- ✅ Avoid high-risk correction cycles
- ✅ Backtested data from the last 20+ years