
June 14, 2026 a 07:31 am
WMT: Dividend Analysis - Walmart Inc.
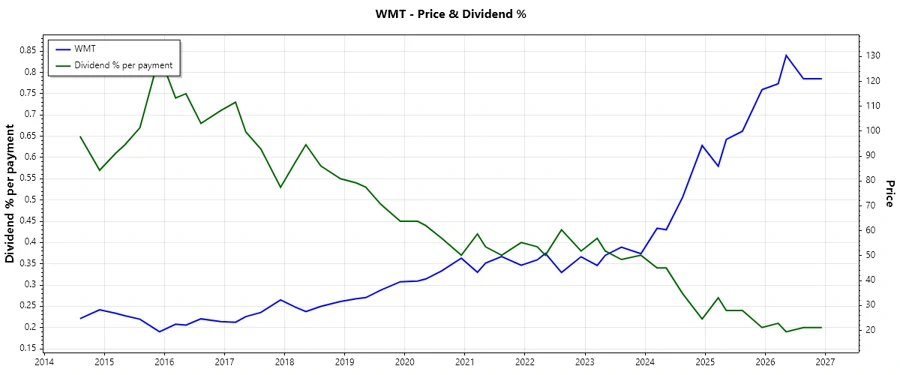
Walmart Inc., a giant in the retail industry, has been a steady dividend payer with a strong track record of dividend history spanning over 53 years. With its robust market position and consistent dividend payouts, Walmart remains a solid choice for dividend investors. However, while it offers stability, the yield currently sits at a moderate 0.82%, reflecting its emphasis on growth and reinvestment.
📊 Overview
Walmart operates in the Consumer Defensive sector, which is known for stable and reliable performances. The company provides a modest dividend yield of 0.82%, with a current dividend per share of $0.94. It has an impressive dividend history over 53 years, with the last significant dividend cut or suspension occurring in 1982, indicating a strong commitment to rewarding shareholders.
| Sector | Dividend Yield (%) | Current Dividend Per Share (USD) | Dividend History (Years) | Last Cut/Suspension |
|---|---|---|---|---|
| Consumer Defensive | 0.82 | 0.94 | 53 | 1982 |
🗣️ Dividend History
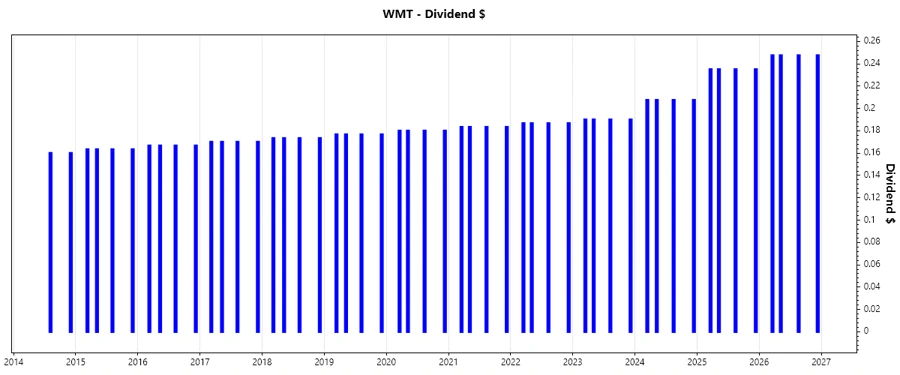
Walmart's dividend history underscores its ongoing commitment to shareholders. With over five decades of continuous payouts, the company demonstrates an ability to sustain and potentially grow its dividends. This historical consistency is vital for long-term investors focusing on income stability.
| Year | Dividend Per Share (USD) |
|---|---|
| 2026 | 0.99 |
| 2025 | 0.94 |
| 2024 | 0.83 |
| 2023 | 0.76 |
| 2022 | 0.75 |
📈 Dividend Growth
Dividend growth is a critical indicator of a company's capacity to increase shareholder returns. Over the past three years, Walmart's dividends have grown by 7.98%, while the five-year growth is slightly lower at 5.48%. This highlights a steady though conservative approach to dividend enhancement.
| Time | Growth (%) |
|---|---|
| 3 years | 7.98 |
| 5 years | 5.48 |
The average dividend growth is 5.48% over 5 years. This shows moderate but steady dividend growth.
✅ Payout Ratio
The payout ratio is a key measure for assessing dividend sustainability. An EPS-based payout ratio of 32.50% indicates a solid buffer for absorbing earnings fluctuations without jeopardizing dividends. Meanwhile, the free cash flow-based payout ratio stands at 59.62%, reflecting its ability to comfortably cover dividends through cash generated from operations.
| Payout Ratio | Percentage (%) |
|---|---|
| EPS-based | 32.50 |
| Free cash flow-based | 59.62 |
While the EPS payout ratio suggests prudent management, the higher FCF payout ratio signifies higher leverage on available cash, but within acceptable industry norms.
⚠️ Cashflow & Capital Efficiency
Walmart's cashflows illustrate a disciplined approach to capital allocation. The free cash flow yield is 1.30% while the earnings yield is 2.39%, illustrating cash flow effectiveness. Capital expenditures account for 69.30% of operating cash flow, indicative of ongoing reinvestment for growth and efficiency. Stock-based compensation related to revenue is at 0%, reflecting restrained equity dilution.
| Year | 2026 | 2025 | 2024 |
|---|---|---|---|
| Free Cash Flow Yield | 1.57% | 1.60% | 3.40% |
| Earnings Yield | 2.30% | 2.46% | 3.48% |
| CAPEX to Operating Cash Flow | 64.10% | 65.26% | 57.68% |
| Stock-based Compensation to Revenue | 0% | 0% | 0% |
| FCF / Operating Cash Flow Ratio | 35.90% | 34.74% | 42.32% |
The data reflect a balanced approach to sustaining operations and funding future growth, maintaining a robust operational cash flow structure.
🔍 Balance Sheet & Leverage Analysis
Debt metrics are crucial for evaluating financial health. Walmart's debt-to-equity ratio at 67.35% and debt-to-assets ratio at 23.57% indicate a manageable level of leverage. The current and quick ratios, although below the conventional benchmarks, align with typical retail sector metrics given the continuous cash flow cycles.
| Year | 2026 | 2025 | 2024 |
|---|---|---|---|
| Debt-to-Equity | 67.35% | 66.05% | 73.12% |
| Debt-to-Assets | 23.57% | 23.05% | 24.30% |
| Debt-to-Capital | 40.25% | 39.78% | 42.24% |
| Net Debt to EBITDA | 1.21 | 1.22 | 1.41 |
| Current Ratio | 0.79 | 0.82 | 0.83 |
| Quick Ratio | 0.24 | 0.24 | 0.24 |
| Financial Leverage | 2.86 | 2.87 | 3.01 |
The balance sheet demonstrates Walmart's capability to manage its leverage effectively while sustaining liquidity, crucial for ongoing operational resilience.
🌟 Fundamental Strength & Profitability
Profitability metrics highlight the company's efficiency in generating returns. ROE at 24.26% and ROA at 7.96% indicate robust performance relative to asset investment, while margins remain solid despite industry pressures.
| Year | 2026 | 2025 | 2024 |
|---|---|---|---|
| Return on Equity | 21.98% | 21.36% | 18.50% |
| Return on Assets | 7.69% | 7.45% | 6.15% |
| Net Margin | 3.07% | 2.85% | 2.39% |
| EBIT Margin | 4.52% | 4.26% | 3.78% |
| EBITDA Margin | 6.52% | 6.17% | 5.61% |
| Gross Margin | 24.93% | 24.85% | 24.38% |
| R&D to Revenue | 0 | 0 | 0 |
The fundamentals underpin Walmart's continuous ability to secure profitable operations despite the competitive landscape, sustaining its competitive advantage.
💡 Price Development
✅ Dividend Scoring System
| Criteria | Score (out of 5) | Score Bar |
|---|---|---|
| Dividend Yield | 3 | |
| Dividend Stability | 5 | |
| Dividend Growth | 4 | |
| Payout Ratio | 4 | |
| Financial Stability | 5 | |
| Dividend Continuity | 5 | |
| Cashflow Coverage | 4 | |
| Balance Sheet Quality | 5 |
Total Score: 35/40
🗣️ Rating
Walmart Inc. stands as a stalwart in the dividend space with strong financial metrics, reliable dividend growth, and exceptional stability. It is an excellent choice for investors seeking consistent returns alongside steady capital appreciation. While the dividend yield is rather moderate, the company's comprehensive financial strategy and steadfast management ensure a balanced risk-return proposition. Recommended for income investors who prioritize stability and long-term capital security.
Smart Data Insight
Master the Perfect Entry & Exit for this Stock
Don't leave your profits to chance. Historically, this stock follows specific seasonal patterns that institutional traders use to maximize returns.
- ✅ Identify the "Golden Buying Window"
- ✅ Avoid high-risk correction cycles
- ✅ Backtested data from the last 20+ years