January 29, 2026 a 07:31 am

WMT: Dividend Analysis - Walmart Inc.
Walmart Inc. (NYSE: WMT) exhibits a strong dividend profile with consistent payouts over 52 years, marking it as a distinguished dividend-paying entity in the retail sector. The company's commitment to steady dividend growth is evident through its historical performance, reinforcing its reputation among income-focused investors. This analysis delves into various aspects of Walmart's dividends and assesses the financial health underpinning these distributions.
📊 Overview
Walmart operates within the Retail sector, providing a modest but reliable dividend yield of 0.81%. With a current dividend per share of approximately $0.83 and a history of 52 years without significant cuts since 1982, the company projects stability and resilience.
| Metric | Details |
|---|---|
| Sector | Retail |
| Dividend yield | 0.81% |
| Current dividend per share | 0.83 USD |
| Dividend history | 52 years |
| Last cut or suspension | 1982 |
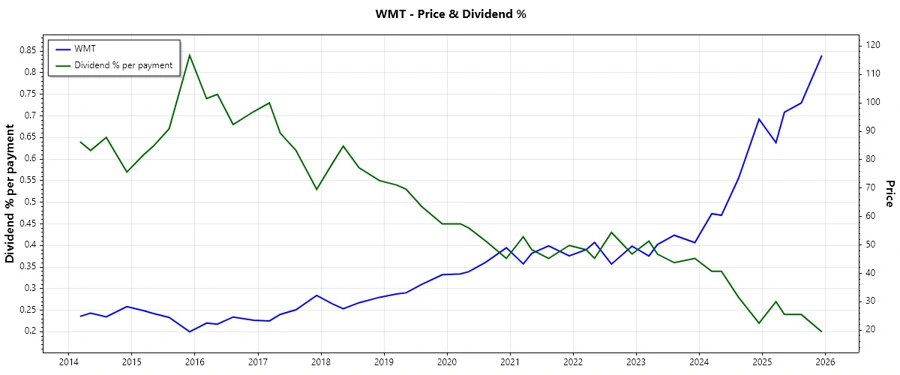
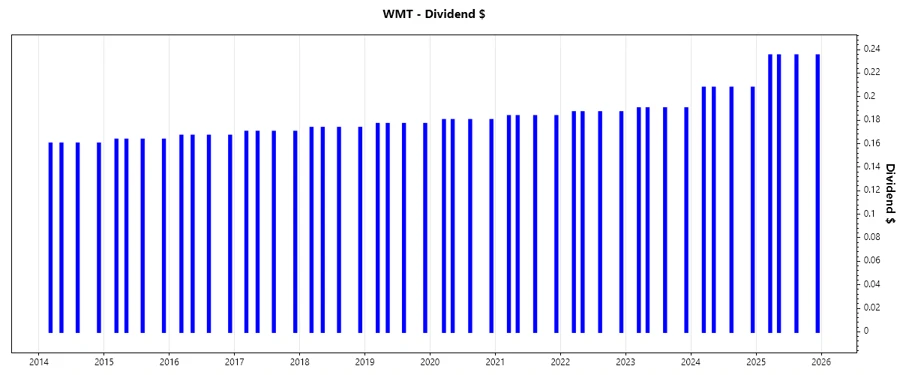
🗣️ Dividend History
Examining the dividend history reveals Walmart's robust distribution policy. The historical progression of dividends reflects the company's strategic priorities in maintaining shareholder returns while balancing growth investments.
| Year | Dividend Per Share (USD) |
|---|---|
| 2025 | 0.94 |
| 2024 | 0.83 |
| 2023 | 0.76 |
| 2022 | 0.74668 |
| 2021 | 0.73332 |
📈 Dividend Growth
The significance of dividend growth lies in its ability to contribute to overall total shareholder return. Walmart's moderate yet steady growth is indicative of its strategic emphasis on sustaining long-term returns.
| Time | Growth |
|---|---|
| 3 years | 7.98% |
| 5 years | 5.48% |
The average dividend growth is 5.48% over 5 years. This shows moderate but steady dividend growth.
🔍 Payout Ratio
Payout ratios serve as a critical measure of dividend sustainability. Evaluating both EPS and Free Cash Flow payout ratios provides insight into Walmart's capability to support its dividend policies.
| Key figure | Ratio |
|---|---|
| EPS-based | 28.95% |
| Free cash flow-based | 20.43% |
The EPS payout ratio of 28.95% and FCF payout ratio of 20.43% suggest that Walmart's dividends are adequately covered, underscored by manageable distribution levels.
💵 Cashflow & Capital Efficiency
An analysis of cash flow metrics highlights Walmart's operational competency and capital deployment strategies. Key indicators demonstrate resource management efficacy and financial robustness.
| Metric | 2023 | 2024 | 2025 |
|---|---|---|---|
| Free Cash Flow Yield | 3.06% | 3.40% | 1.60% |
| Earnings Yield | 2.98% | 3.49% | 2.46% |
| CAPEX to Operating Cash Flow | 58.45% | 57.68% | 65.27% |
| Stock-based Compensation to Revenue | 0% | 0% | 0% |
| Free Cash Flow / Operating Cash Flow Ratio | 41.55% | 42.32% | 34.74% |
The consistency in cash flow ratios indicates a stable cash generation capacity and prudent capital efficiency strategies.
📉 Balance Sheet & Leverage Analysis
A comprehensive evaluation of leverage ratios provides insights into financial risk. Walmart's balance sheet reflects its strategic debt management and prudent leverage utilization.
| Metric | 2023 | 2024 | 2025 |
|---|---|---|---|
| Debt-to-Equity | 0.77 | 0.73 | 0.66 |
| Debt-to-Assets | 24.23% | 24.30% | 23.05% |
| Debt-to-Capital | 43.45% | 42.24% | 39.78% |
| Net Debt to EBITDA | 1.67 | 1.41 | 1.22 |
| Current Ratio | 0.82 | 0.83 | 0.82 |
| Quick Ratio | 0.21 | 0.24 | 0.24 |
| Financial Leverage | 3.17 | 3.01 | 2.87 |
The metrics point to a robust leverage framework with adequate buffers against financial volatility, enhancing Walmart's ability to sustain its dividend payments.
🚀 Fundamental Strength & Profitability
Key profitability metrics are indicative of Walmart's operational efficiency and strategic positioning in competitive markets.
| Metric | 2023 | 2024 | 2025 |
|---|---|---|---|
| Return on Equity | 15.23% | 18.50% | 21.36% |
| Return on Assets | 4.80% | 6.15% | 7.51% |
| Margins: Net | 1.91% | 2.39% | 2.85% |
| EBIT | 3.13% | 3.78% | 4.26% |
| EBITDA | 4.92% | 5.61% | 6.17% |
| Gross | 24.14% | 24.38% | 24.85% |
| Research & Development to Revenue | 0 | 0 | 0 |
The improving profitability metrics across the board underscore Walmart's prowess in resource utilization, supporting both strategic growth and investor returns.
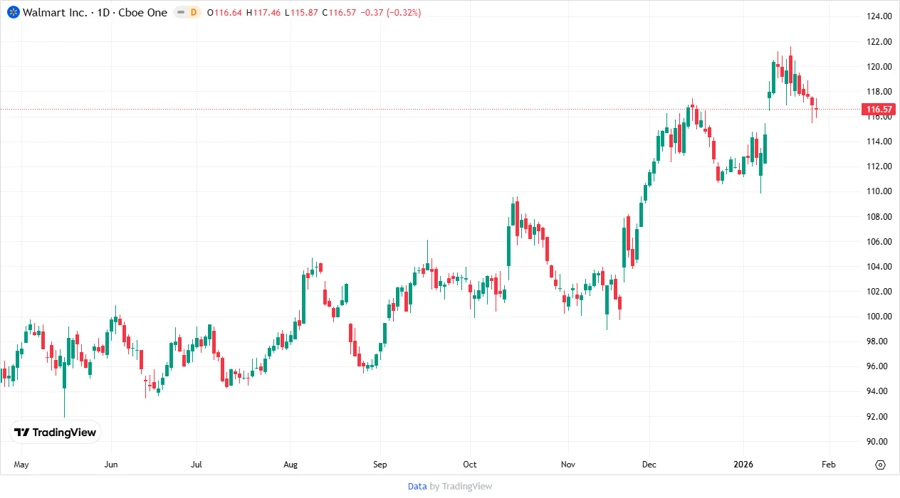
📉 Price Development
🔢 Dividend Scoring System
| Category | Score | |
|---|---|---|
| Dividend yield | 3 | |
| Dividend Stability | 5 | |
| Dividend growth | 4 | |
| Payout ratio | 5 | |
| Financial stability | 4 | |
| Dividend continuity | 5 | |
| Cashflow Coverage | 4 | |
| Balance Sheet Quality | 4 |
Total Score: 34/40
✅ Rating
Overall, Walmart presents a strong dividend investment opportunity characterized by stability, measured growth, and robust financial defenses. Its balanced approach to rewarding shareholders, while ensuring operational efficiency, makes Walmart a suitable holding for dividend-focused portfolios.