July 07, 2025 a 07:46 am

WMT: Dividend Analysis - Walmart Inc.
Walmart Inc. showcases a remarkable dividend profile supported by over 52 years of uninterrupted dividend payments. The company continues to deliver value to shareholders with a stable dividend yield and moderate growth rates, aligning with shareholders' interests for steady income and capital appreciation. However, careful monitoring of payout ratios and cash flow stability remains important to ensure continued financial health and dividend sustainability.
📊 Overview
The analysis of Walmart Inc.'s dividend data reflects its robust financial standing within the Consumer Staples sector.
| Metric | Details |
|---|---|
| Sector | Consumer Staples |
| Dividend yield | 0.96% |
| Current dividend per share | 0.83 USD |
| Dividend history | 52 years |
| Last cut or suspension | 1982 |
🗣️ Dividend History
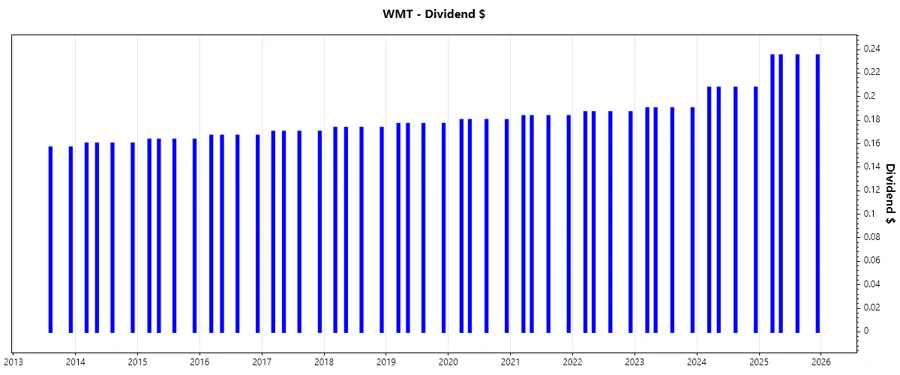
Walmart Inc. has maintained a steady and reliable dividend history, which is an indicator of financial stability and company discipline. A consistent dividend policy over decades implies Walmart's commitment to returning income to its shareholders.
| Year | Dividend per Share (USD) |
|---|---|
| 2025 | 0.940 |
| 2024 | 0.830 |
| 2023 | 0.760 |
| 2022 | 0.74668 |
| 2021 | 0.73332 |
📈 Dividend Growth
The dividend growth rate indicates a company's ability to increase dividends, reflecting financial health and stable cash flow generation.
| Time | Growth |
|---|---|
| 3 years | 4.21% |
| 5 years | 3.27% |
The average dividend growth is 3.27% over 5 years. This shows moderate but steady dividend growth.
⚠️ Payout Ratio
Payout ratios are crucial to assess whether dividends paid are sustainable compared to earnings and free cash flow.
| Key figure | Ratio |
|---|---|
| EPS-based | 35.41% |
| Free cash flow-based | 49.12% |
The EPS payout ratio of 35.41% and FCF payout ratio of 49.12% suggest a conservative approach to dividend distributions, leaving room for growth and investment opportunities.
🗓️ Cashflow & Capital Efficiency
Cash flow stability and capital efficiency are integral to sustaining a solid dividend policy and operational health.
| Metric | 2023 | 2024 | 2025 |
|---|---|---|---|
| Free Cash Flow Yield | 3.06% | 3.40% | 1.60% |
| Earnings Yield | 2.98% | 3.49% | 2.46% |
| CAPEX to Operating Cash Flow | 58.45% | 57.68% | 65.26% |
| Stock-based Compensation to Revenue | 0.26% | 0.00% | 0.00% |
| Free Cash Flow / Operating Cash Flow Ratio | 41.55% | 42.32% | 34.74% |
Walmart's capacity to maintain a supportive cash flow further reassures its dividend sustainability and strengthens its financial footing.
🛠️ Balance Sheet & Leverage Analysis
The balance sheet analysis provides insight into a company's financial leverage and overall risk profile, crucial for long-term dividend viability.
| Metric | 2023 | 2024 | 2025 |
|---|---|---|---|
| Debt-to-Equity | 76.83% | 73.12% | 66.05% |
| Debt-to-Assets | 24.23% | 24.30% | 23.05% |
| Debt-to-Capital | 43.45% | 42.24% | 39.78% |
| Net Debt to EBITDA | 1.67 | 1.32 | 1.49 |
| Current Ratio | 0.82 | 0.83 | 0.78 |
| Quick Ratio | 0.21 | 0.24 | 0.24 |
| Financial Leverage | 3.17 | 3.01 | 2.87 |
A lower debt ratio indicates effective leverage management, reducing risk exposure and underscoring Walmart's financial robustness.
📏 Fundamental Strength & Profitability
Evaluation of key financial metrics highlights Walmart's operational success and shareholder value creation.
| Metric | 2023 | 2024 | 2025 |
|---|---|---|---|
| Return on Equity | 15.23% | 18.50% | 21.36% |
| Return on Assets | 4.80% | 6.15% | 7.45% |
| Margins: Net | 1.91% | 2.39% | 2.85% |
| Margins: EBIT | 3.13% | 3.78% | 4.26% |
| Margins: EBITDA | 4.92% | 6.00% | 4.31% |
| Margins: Gross | 24.14% | 24.38% | 24.85% |
| R&D to Revenue | 0.00% | 0.00% | 0.00% |
Walmart's profitability metrics indicate effective resource utilization and a strong potential for wealth generation, reinforcing its investment appeal.
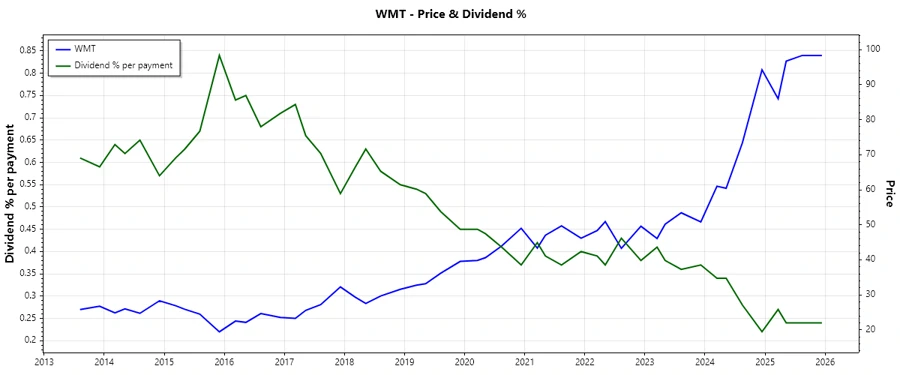
⚡ Price Development
🎯 Dividend Scoring System
| Category | Score | Score Bar |
|---|---|---|
| Dividend yield | 3/5 | |
| Dividend Stability | 4/5 | |
| Dividend growth | 3/5 | |
| Payout ratio | 4/5 | |
| Financial stability | 4/5 | |
| Dividend continuity | 5/5 | |
| Cashflow Coverage | 3/5 | |
| Balance Sheet Quality | 4/5 |
Overall Score: 30/40
✅ Rating
Walmart Inc. is rated as a solid dividend investment option given its extensive history of dividend payments, combined with low payout ratios and good financial stability. Investors seeking steady income streams with a potential for moderate growth may find Walmart an attractive proposition. Monitoring market trends and financial performance remains imperative to support sound investment decisions.
Smart Data Insight
Master the Perfect Entry & Exit for this Stock
Don't leave your profits to chance. Historically, this stock follows specific seasonal patterns that institutional traders use to maximize returns.
- ✅ Identify the "Golden Buying Window"
- ✅ Avoid high-risk correction cycles
- ✅ Backtested data from the last 20+ years