
May 30, 2026 a 01:15 pm

WMB: Trend and Support & Resistance Analysis - The Williams Companies, Inc.
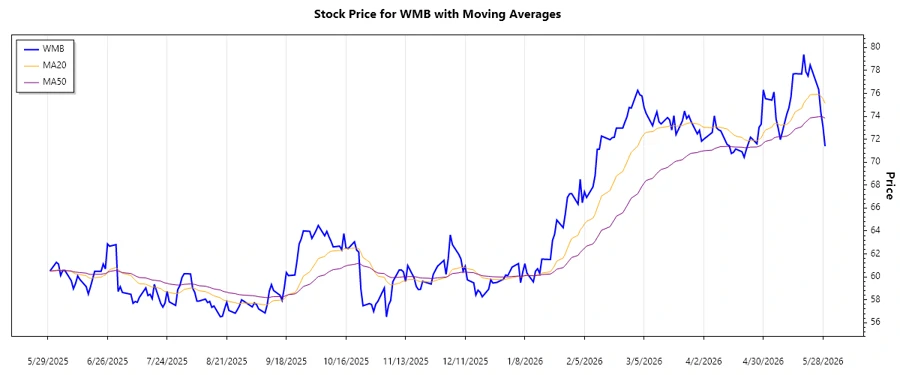
The Williams Companies, Inc. has experienced significant fluctuations over the past months, with a recent dominant trend emerging. The analysis of the two main EMAs, EMA20 and EMA50, provides critical insight into the current market sentiment. As part of the energy infrastructure sector, WMB is subject to various intrinsic and extrinsic influences that impact its stock performance. The following technical analysis delves deeper into trend directions and pivotal support and resistance zones.
Trend Analysis
| Date | Closing Price | Trend |
|---|---|---|
| 2026-05-29 | 71.39 | ⬇ Abwärtstrend |
| 2026-05-28 | 73.13 | ⬇ Abwärtstrend |
| 2026-05-27 | 74.37 | ⬇ Abwärtstrend |
| 2026-05-26 | 76.34 | ↔ Seitwärtstrend |
| 2026-05-22 | 78.47 | ↔ Seitwärtstrend |
| 2026-05-21 | 77.52 | ⬆ Aufwärtstrend |
| 2026-05-20 | 77.88 | ⬆ Aufwärtstrend |
The EMA analysis shows a shift from a neutral to a downward trend, indicating potential bearish market sentiment in the past few days. This shift suggests caution, as the market appears to be losing upward momentum.
Support and Resistance
| Zone Type | From | To |
|---|---|---|
| Support Zone 1 | 69.00 | 70.50 |
| Support Zone 2 | 72.00 | 73.50 |
| Resistance Zone 1 | 75.00 | 76.50 |
| Resistance Zone 2 | 77.50 | 79.00 |
Currently, the stock price hovers near a critical support zone, which could act as a potential pivot point for future direction. Observing if it holds or breaks this level will be crucial for the short-term outlook.
Conclusion
Overall, WMB shows a recent bearish trend with potential support around the current price level. This suggests caution
as the stock could break further down or stabilize. Energy infrastructure initiatives and market factors can influence
stock performance. Investors should closely monitor economic indicators and sector developments. An unexplored upward
momentum can pose opportunities if the resistance zones are breached. However, a sustained break below support might
indicate further declines. Monitoring these levels and market sentiment will be critical for future strategies.
Smart Data Insight
Master the Perfect Entry & Exit for this Stock
Don't leave your profits to chance. Historically, this stock follows specific seasonal patterns that institutional traders use to maximize returns.
- ✅ Identify the "Golden Buying Window"
- ✅ Avoid high-risk correction cycles
- ✅ Backtested data from the last 20+ years