September 28, 2025 a 02:03 pm
WMB: Trend and Support & Resistance Analysis - The Williams Companies, Inc.
The Williams Companies, Inc., operating in the energy infrastructure sector, has shown significant fluctuation in stock prices over the past months. With strong fundamentals backed by extensive pipeline and processing facilities, the company remains resilient in the face of market volatility. Recent trends suggest optimism for investors with an identifiable potential for growth.
Trend Analysis
| Date | Close Price | Trend |
|---|---|---|
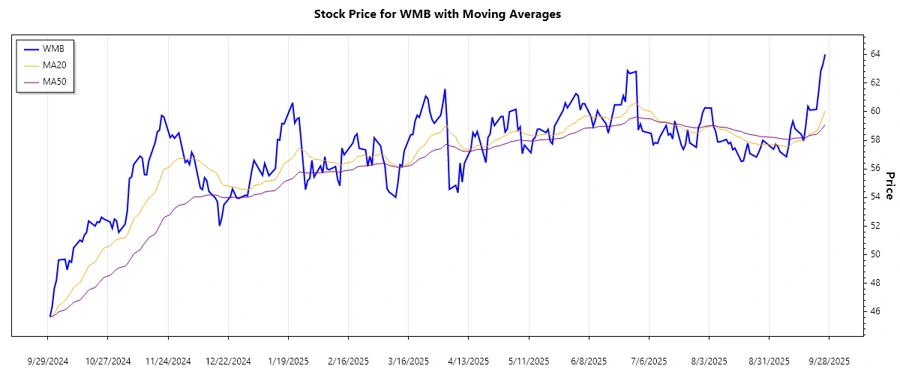
| 2025-09-26 | 64.01 | ▲ Upward |
| 2025-09-25 | 63.31 | ▲ Upward |
| 2025-09-24 | 62.86 | ▲ Upward |
| 2025-09-23 | 61.39 | ▲ Upward |
| 2025-09-22 | 60.16 | ▲ Upward |
| 2025-09-19 | 60.11 | ▲ Upward |
| 2025-09-18 | 60.38 | ▲ Upward |
The exponential moving averages (EMAs) suggest a consistent upward trend over the recent period. With EMA20 surpassing EMA50, a bullish trend is confirmed. This indicates potential growth and investor confidence.
Support- and Resistance
| Zone Type | Range |
|---|---|
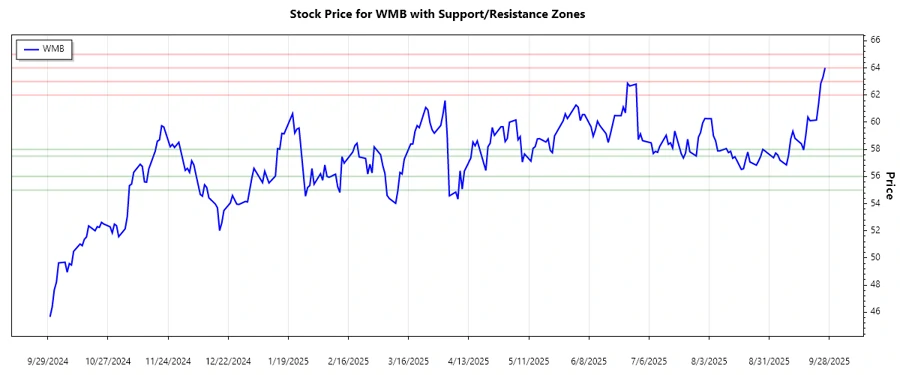
| Support Zone 1 | ⬇️ 57.50 - 58.00 |
| Support Zone 2 | ⬇️ 55.00 - 56.00 |
| Resistance Zone 1 | ⬆️ 62.00 - 63.00 |
| Resistance Zone 2 | ⬆️ 64.00 - 65.00 |
Currently, the stock price is advancing towards the upper resistance zone, indicating potential for breakout. Monitoring these levels is crucial for understanding future price movements.
Conclusion
The recent analysis points to a bullish trend for The Williams Companies, Inc. The convergence of support and resistance levels suggests pivotal momentum, presenting both opportunities and risks. As the stock tests its resistance, potential for breakout could offer lucrative returns. However, vigilance is advisable due to inherent market volatilities. For analysts, monitoring EMA crossovers and zone breaches is essential to anticipate price actions accurately.
Smart Data Insight
Master the Perfect Entry & Exit for this Stock
Don't leave your profits to chance. Historically, this stock follows specific seasonal patterns that institutional traders use to maximize returns.
- ✅ Identify the "Golden Buying Window"
- ✅ Avoid high-risk correction cycles
- ✅ Backtested data from the last 20+ years