
June 14, 2026 a 03:43 pm
WMB: Fundamental Ratio Analysis - The Williams Companies, Inc.
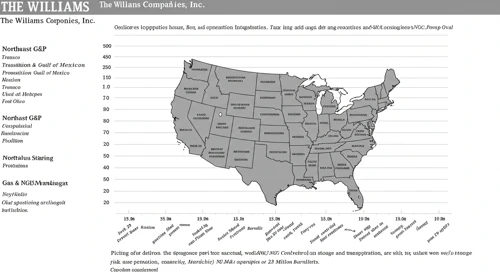
The Williams Companies, Inc., a key player in the energy infrastructure sector, shows a stable growth trajectory supported by robust pipeline and processing assets. Despite financial leverage, the company remains a formidable force in the midstream industry.
Fundamental Rating
The Williams Companies currently holds a B- rating, with an overall score of 3. The scores of individual components provide insights into the company's financial strengths and weaknesses.
| Category | Score | Visualization |
|---|---|---|
| Discounted Cash Flow | 3 | |
| Return on Equity | 5 | |
| Return on Assets | 4 | |
| Debt to Equity | 1 | |
| Price to Earnings | 1 | |
| Price to Book | 1 |
Historical Rating
Recent scores indicate consistent performance over time with no notable changes in individual ratings.
| Date | Overall | Discounted Cash Flow | Return on Equity | Return on Assets | Debt to Equity | Price to Earnings | Price to Book |
|---|---|---|---|---|---|---|---|
| 2026-06-12 | 3 | 3 | 5 | 4 | 1 | 1 | 1 |
| Previous | 0 | 3 | 5 | 4 | 1 | 1 | 1 |
Analyst Price Targets
Analysts maintain a positive outlook with a buy consensus, anticipating price elevations in the near future.
| High | Low | Median | Consensus |
|---|---|---|---|
| $98 | $73 | $83.5 | $83.75 |
Analyst Sentiment
The consensus leans towards a buy, driven by substantial buy recommendations against a minimal number of holds.
| Recommendation | Count | Distribution |
|---|---|---|
| Strong Buy | 0 | |
| Buy | 27 | |
| Hold | 7 | |
| Sell | 0 | |
| Strong Sell | 0 |
Conclusion
Overall, The Williams Companies, Inc. presents a strong fundamental profile with positive analyst outlooks and consistent historical performance, making it an attractive investment option within the energy sector. The company’s expansive asset base and strategic operations across significant natural gas and NGL regions might mitigate risks associated with its debt levels. However, investors should remain vigilant regarding fluctuating energy prices and regulatory changes. With a strong buy consensus, the stock offers an appealing opportunity for growth-focused portfolios.
Smart Data Insight
Master the Perfect Entry & Exit for this Stock
Don't leave your profits to chance. Historically, this stock follows specific seasonal patterns that institutional traders use to maximize returns.
- ✅ Identify the "Golden Buying Window"
- ✅ Avoid high-risk correction cycles
- ✅ Backtested data from the last 20+ years