
July 04, 2026 a 03:15 pm
WMB: Fibonacci Analysis - The Williams Companies, Inc.
The Williams Companies, Inc. (WMB) has been experiencing a recent downward trend influenced by market volatility and sector-specific challenges. Despite the ongoing downturn, WMB remains a vital player in the energy infrastructure domain. Investors should cautiously monitor potential reversal signals and retracement opportunities to capitalize on future growth prospects. With a focus on natural gas pipelines and processing, WMB's operations are well-positioned to withstand market fluctuations, though short-term bearish pressures cannot be overlooked.
Fibonacci Analysis
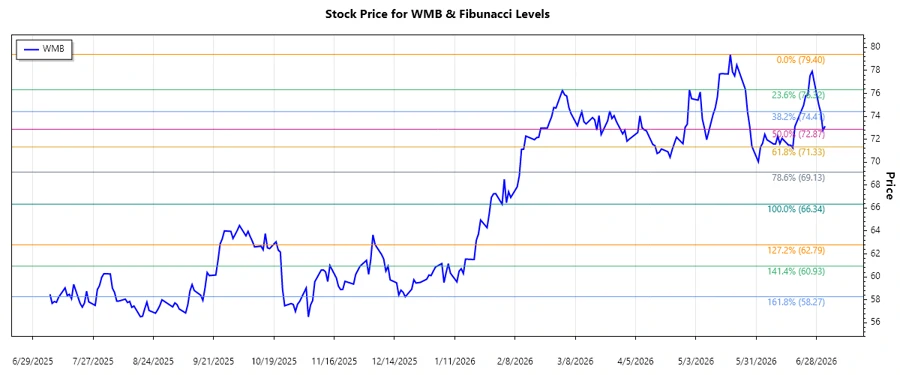
The analysis of the WMB stock, using its recent price movements, suggests a dominant downtrend. We have identified the high point at $79.40 on 2026-05-19 and the low point at $66.34 on 2026-02-02. Using these data points, Fibonacci retracement levels are calculated to anticipate potential support and resistance levels, indicating where the market price might retrace before resuming the trend.
| High Date | High Price | Low Date | Low Price |
|---|---|---|---|
| 2026-05-19 | $79.40 | 2026-02-02 | $66.34 |
| Level | Retracement Price |
|---|---|
| 0.236 | $76.13 |
| 0.382 | $74.32 |
| 0.5 | $72.87 |
| 0.618 | $71.42 |
| 0.786 | $69.41 |
The current price of $73.14 (as of 2026-07-02) indicates that the stock is within the 0.5 retracement zone. In technical terms, this level often acts as a strong support or resistance area, potentially indicating a pause or reversal in the downtrend. Observing the price action around this level will be crucial for future predictions.
Conclusion
The Williams Companies, Inc. is navigating a challenging market environment, reflected in its current downtrend. While this presents risks, it also provides potential buying opportunities should reversal signals manifest near key retracement levels. The 0.5 Fibonacci level, in particular, stands out as a significant area to watch. Overall, despite the bearish trend, WMB's strong operational position in the energy sector underscores its potential for recovery and future upside, emphasizing the importance of strategic entry points derived from technical analyses.
Smart Data Insight
Master the Perfect Entry & Exit for this Stock
Don't leave your profits to chance. Historically, this stock follows specific seasonal patterns that institutional traders use to maximize returns.
- ✅ Identify the "Golden Buying Window"
- ✅ Avoid high-risk correction cycles
- ✅ Backtested data from the last 20+ years