March 01, 2026 a 04:44 pm
WMB: Fibonacci Analysis - The Williams Companies, Inc.
The Williams Companies, Inc., a leading energy infrastructure entity, has shown significant price movements over the analyzed period. The company benefits from a diverse business model that includes natural gas pipelines, gas gathering, and processing operations across various regions in the US. This diversity may offer resilience against regional market fluctuations. Recent stock performance highlights potential opportunities or risks linked to ongoing energy sector developments. An in-depth technical assessment reveals key levels based on recent trends, suggesting potential price targets and reversals.
Fibonacci Analysis
| Start Date | End Date | High Date | High Price | Low Date | Low Price |
|---|---|---|---|---|---|
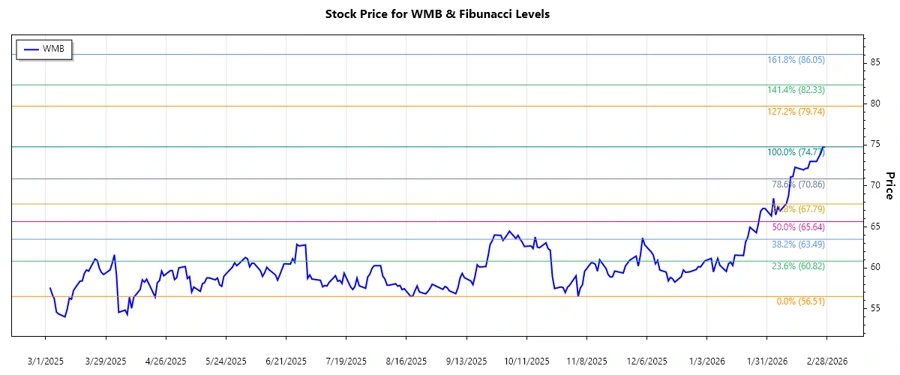
| 2025-07-31 | 2026-02-27 | 2026-02-26 | 74.77 | 2025-07-28 | 56.51 |
| Retracement Level | Price Level |
|---|---|
| 0.236 | 68.92 |
| 0.382 | 66.76 |
| 0.5 | 65.64 |
| 0.618 | 64.51 |
| 0.786 | 62.56 |
As of the last close, the current price is 74.72, which is outside the Fibonacci retracement levels, suggesting a strong trend continuation. The technical implication is that the recent trend may continue unless a significant reversal is observed, providing potential support near lower Fibonacci levels.
Conclusion
The Williams Companies, Inc. has demonstrated an upward trend during the period analyzed, supported by recent market dynamics in the energy sector. The identified retracement levels may offer insights for potential price targets and support areas, with significant implications for technical traders. However, external factors such as regulatory changes and energy pricing adjustments remain crucial considerations for future stock volatility. Analysts should monitor these Fibonacci levels to assess upcoming market moves, while also keeping an eye on industry developments which could alter the existing market trend.