
June 19, 2026 a 07:31 am
WMB: Dividend Analysis - The Williams Companies, Inc.
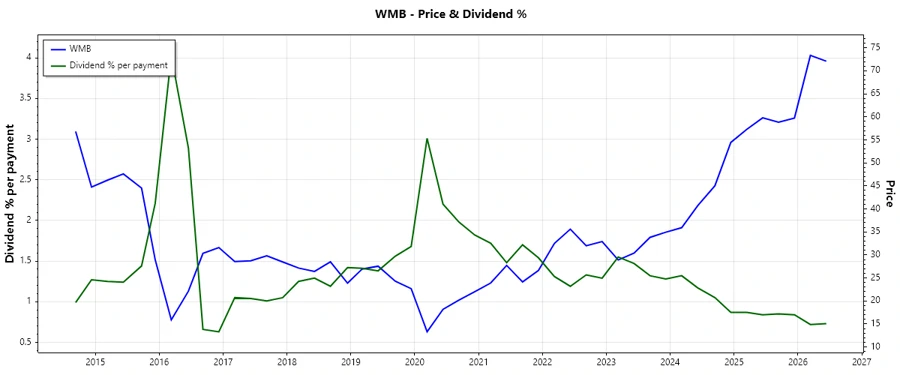
The Williams Companies, Inc. (WMB) presents an attractive profile as a dividend-paying stock, supported by its long-standing history of 45 years without dividend suspension. With a current dividend yield of approximately 2.84%, this company is a consideration for investors looking for income stability. However, the payout ratios which indicate levels of 86% based on EPS and a more concerning 338% on free cash flow suggest vigilance towards the company's capacity to maintain its sustainable dividend policy.
📊 Overview
The Williams Companies, Inc. operates within the utilities sector, a key player known for its consistent dividend payments across four and a half decades. The following table provides a snapshot of the company's dividend metrics:
| Sector | Dividend yield | Current dividend per share | Dividend history | Last cut or suspension |
|---|---|---|---|---|
| Utilities | 2.84 % | $2.00 USD | 45 years | None |
🗣️ Dividend History
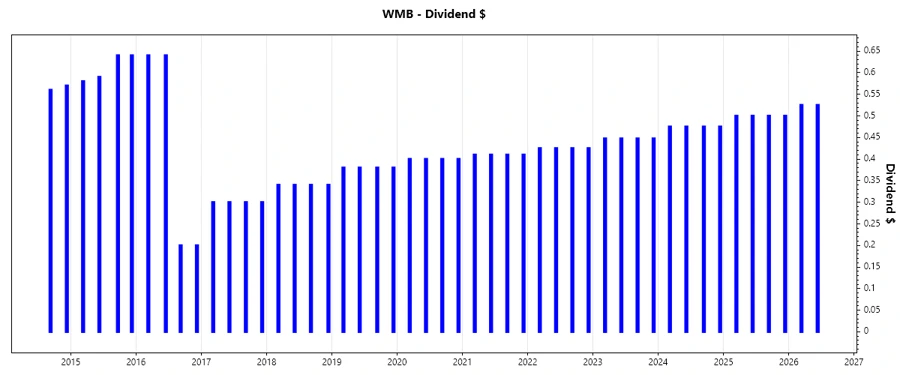
The continuity in dividends over the years signifies the company's commitment to shareholder returns, reflecting fiscal conservatism and robust governance. Understanding the future potential of dividend stability is pivotal for investment analysis.
| Year | Dividend per share |
|---|---|
| 2026 | $1.050 |
| 2025 | $2.00 |
| 2024 | $1.90 |
| 2023 | $1.79 |
| 2022 | $1.70 |
📈 Dividend Growth
The analysis of growth in dividends reveals insights into a company’s capacity to enhance shareholder returns through increased payouts over time.
| Time | Growth |
|---|---|
| 3 years | 5.57 % |
| 5 years | 4.56 % |
The average dividend growth is 4.56% over 5 years. This shows moderate but steady dividend growth, indicating a consistent rise in shareholder returns.
📉 Payout Ratio
Payout ratios are a critical measure of dividend sustainability. They indicate what portion of earnings or cash flows is distributed as dividends. High payout ratios may suggest limited ability to grow dividends substantially without earnings growth.
| Key figure ratio |
|---|
| EPS-based 86.16 % |
| Free cash flow-based 338.78 % |
The EPS-based payout ratio of 86.16% suggests WMB is distributing most of its earnings, leaving back-up funds reliant on earnings performance. The high FCF-based payout ratio of 338.78% is concerning as it exceeds cash flow generation, indicating potential stress on future payouts if current operations continue.
✅ Cashflow & Capital Efficiency
Cash flow metrics highlight the liquidity and asset efficiency, crucial for underpinning dividend payouts and supporting capital structuring activities.
| Year | 2025 | 2024 | 2023 |
|---|---|---|---|
| Free Cash Flow Yield | 1.37 % | 3.64 % | 7.95 % |
| Earnings Yield | 3.57 % | 3.37 % | 7.49 % |
| CAPEX to Operating Cash Flow | 82.96 % | 51.73 % | 43.23 % |
| Stock-based Compensation to Revenue | -0.067 % | 0.943 % | 0.706 % |
| Free Cash Flow / Operating Cash Flow Ratio | 17.04 % | 48.27 % | 56.77 % |
Cashflow stability is compromised by the fluctuating ratios of free cash flow and capital expenditures. High CAPEX compared to cash from operations elucidates a reinvestment that hasn't yet materialized into robust cash flows.
⚠️ Balance Sheet & Leverage Analysis
Assessing leverage ratios assists in gauging debt levels and financial health, impacting the company's strategic flexibility and long-term sustainability of dividend policies.
| Year | 2025 | 2024 | 2023 |
|---|---|---|---|
| Debt-to-Equity | 229.51 % | 217.75 % | 213.37 % |
| Debt-to-Assets | 50.18 % | 49.66 % | 50.28 % |
| Debt-to-Capital | 69.65 % | 68.53 % | 68.09 % |
| Net Debt to EBITDA | 3.96 | 4.11 | 3.15 |
| Current Ratio | 0.83 | 0.50 | 0.77 |
| Quick Ratio | 0.48 | 0.45 | 0.73 |
The elevated debt-to-equity ratio underscores potential liquidity concerns, necessitating rigorous capital management strategies.
📊 Fundamental Strength & Profitability
Profitability measures such as ROE and margins divulge insights into operational effectiveness and cost management, foundational for long-term dividend strategies.
| Year | 2025 | 2024 | 2023 |
|---|---|---|---|
| Return on Equity | 20.44 % | 17.89 % | 25.63 % |
| Return on Assets | 4.47 % | 4.08 % | 6.04 % |
| Margins: Net | 21.91 % | 21.18 % | 29.15 % |
| EBIT | 42.40 % | 41.42 % | 51.71 % |
| EBITDA | 62.04 % | 62.54 % | 70.71 % |
| Gross | 42.86 % | 58.71 % | 62.35 % |
| Research & Development to Revenue | - | - | - |
Despite strong net and EBIT margins, the absence of allocated revenue towards R&D raises concerns about innovation and future market positioning.
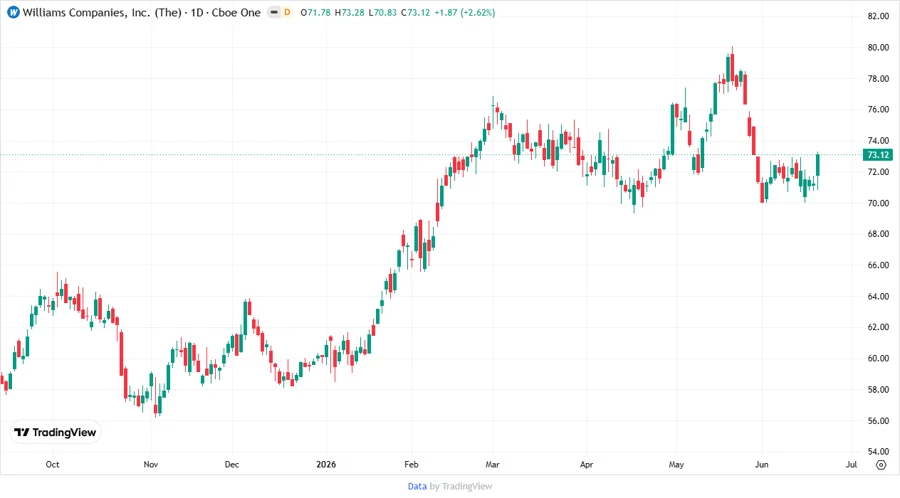
📉 Price Development
✅ Dividend Scoring System
A comprehensive scoring matrix based on critical dividend sustainability and cashflow coverage metrics:
| Criteria | Score | Visual |
|---|---|---|
| Dividend yield | 4 | |
| Dividend stability | 5 | |
| Dividend growth | 3 | |
| Payout ratio | 2 | |
| Financial stability | 3 | |
| Dividend continuity | 5 | |
| Cashflow coverage | 2 | |
| Balance sheet quality | 3 |
Total Score: 27/40
🏆 Rating
The Williams Companies, Inc.'s dividend profile is characterized by outstanding stability and continuity over many years. Although some financial metrics like the payout ratios and high leverage indicate caution, the historical commitment to dividends suggests a potential safe harbor for income-focused portfolios. Maintain vigilance towards financial flexibility given the current payout and leverage statistics, and consider portfolio diversification to mitigate potential risks associated with these factors.
Smart Data Insight
Master the Perfect Entry & Exit for this Stock
Don't leave your profits to chance. Historically, this stock follows specific seasonal patterns that institutional traders use to maximize returns.
- ✅ Identify the "Golden Buying Window"
- ✅ Avoid high-risk correction cycles
- ✅ Backtested data from the last 20+ years