April 12, 2026 a 07:31 am
WMB: Dividend Analysis - The Williams Companies, Inc.
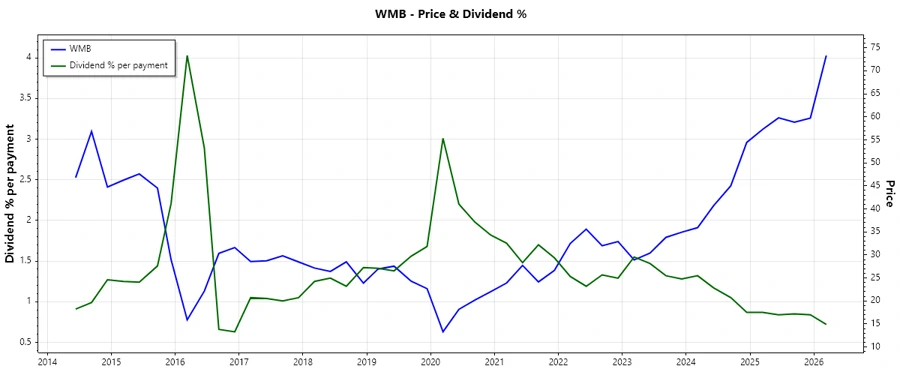
The Williams Companies, Inc. (NYSE: WMB) is a vital player in the energy infrastructure sector with a solid history of steady dividend payments. With over 45 years of uninterrupted dividend history, it showcases robust reliability in shareholder returns. However, the high dividend yield should be weighed against its payout ratios, which demand scrutiny due to potential sustainability concerns. As a stable energy-sector entity, it maintains a consistent dividend yield around 2.76%, appealing to income-focused investors.
📊 Overview
The Williams Companies, Inc. operates in a sector known for its stable cash flows, contributing to its resilient dividend yield. The company's dividend strategy reflects its reliable performance and commitment to returning capital to shareholders.
| Metric | Value |
|---|---|
| Sector | Energy Infrastructure |
| Dividend Yield | 2.76% |
| Current Dividend per Share | $2.00 |
| Dividend History | 45 years |
| Last Cut or Suspension | None |
🗣️ Dividend History
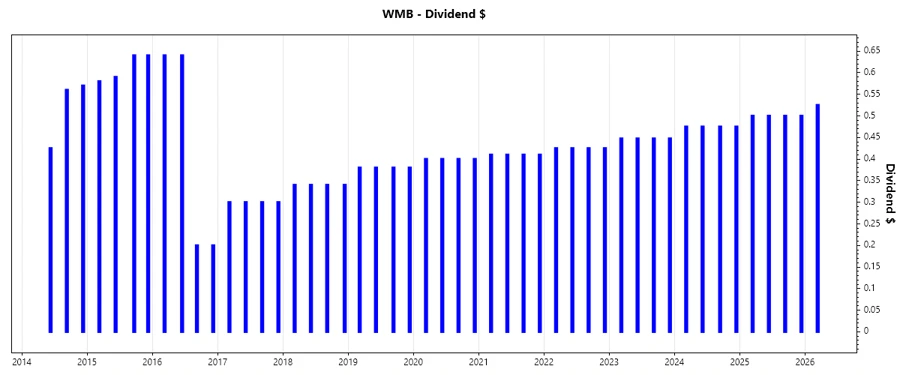
The historical dividend policy of The Williams Companies, Inc. reflects a strong commitment to its shareholders. Maintaining a consistent dividend payout for over 45 years indicates resilience and reliability, crucial for long-term investors seeking regular income streams.
| Year | Dividend Per Share |
|---|---|
| 2026 | $0.525 |
| 2025 | $2.000 |
| 2024 | $1.900 |
| 2023 | $1.790 |
| 2022 | $1.700 |
📈 Dividend Growth
Evident in its history, The Williams Companies has demonstrated moderate dividend growth, enhancing shareholder value. Understanding this growth trajectory aids in evaluating future dividend prospects and investment stability.
| Time | Growth |
|---|---|
| 3 years | 0.056% |
| 5 years | 0.046% |
The average dividend growth is 0.046% over 5 years. This shows moderate but steady dividend growth.
⚖️ Payout Ratio
Payout ratios are a key indicator of dividend sustainability. The Williams Companies' EPS-based payout ratio raises caution due to its high percentage, suggesting close monitoring is required to ensure dividend sustainability.
| Key figure | Ratio |
|---|---|
| EPS-based | 93.35% |
| Free cash flow-based | 272.05% |
The EPS payout ratio of 93.35% suggests profit margins are barely covering dividends, raising concerns unless supported by consistent cash flow generation, which could be strained given the high 272.05% FCF payout.
💼 Cashflow & Capital Efficiency
Examining cash flow and capital efficiency unveils a company's capacity for dividend payouts. The Free Cash Flow Yield, CAPEX to Operating Cash Flow, and other metrics depict an intricate picture of financial robustness.
| Metric | 2025 | 2024 | 2023 |
|---|---|---|---|
| Free Cash Flow Yield | 1.37% | 3.64% | 7.95% |
| Earnings Yield | 3.57% | 3.37% | 7.49% |
| CAPEX to Operating Cash Flow | 82.96% | 51.73% | 43.23% |
| Stock-based Compensation to Revenue | 0% | 0.94% | 0.71% |
| Free Cash Flow / Operating Cash Flow Ratio | 17.04% | 48.27% | 56.77% |
The cash flow metrics reveal a company effective in capital utilization, although dependence on higher operating cash flows could be essential to cover capital expenditures and maintain dividend payouts.
🏦 Balance Sheet & Leverage Analysis
Comprehending leverage and liquidity is vital for dividend coverage analysis. Examining the Williams Companies' debt management reflects its leveraged strategy, common in capital-intensive sectors.
| Metric | 2025 | 2024 | 2023 |
|---|---|---|---|
| Debt-to-Equity | 2.29 | 2.18 | 2.13 |
| Debt-to-Assets | 50.13% | 49.65% | 50.28% |
| Debt-to-Capital | 69.63% | 68.53% | 68.09% |
| Net Debt to EBITDA | 3.95 | 4.11 | 3.15 |
| Current Ratio | 0.53 | 0.50 | 0.77 |
| Quick Ratio | 0.48 | 0.45 | 0.73 |
| Financial Leverage | 4.57 | 4.39 | 4.24 |
Williams Companies' leverage metrics reflect its high reliance on debt to fuel growth in a capital-intensive industry, highlighting the need for strong operational cash flows and effective debt management to sustain dividends.
📉 Fundamental Strength & Profitability
Evaluating fundamental strengths like return metrics aids in identifying how efficiently a company uses its resources. For The Williams Companies, a mix of robust return ratios against profit margins unfolds its operational efficiency.
| Metric | 2025 | 2024 | 2023 |
|---|---|---|---|
| Return on Equity | 20.44% | 17.89% | 25.63% |
| Return on Assets | 4.47% | 4.08% | 6.04% |
| Margins: Net | 21.91% | 21.18% | 29.15% |
| Margins: EBIT | 42.82% | 41.42% | 51.72% |
| Margins: EBITDA | 62.04% | 62.54% | 70.71% |
| Margins: Gross | 42.86% | 58.71% | 62.35% |
| R&D to Revenue | 0% | 0% | 0% |
Analyzing profitability, the metrics suggest that The Williams Companies is effectively deploying its resources to achieve strong margins, critical for funding and sustaining dividends in a volatile energy market.
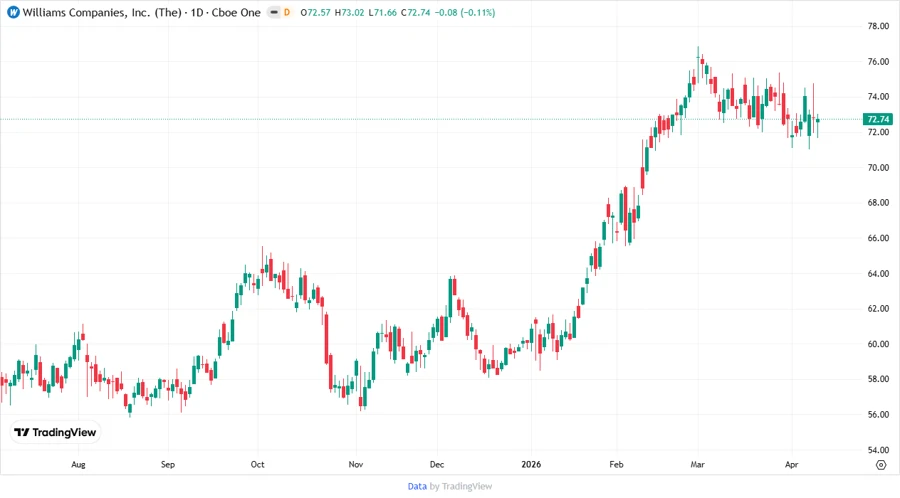
📈 Price Development
📊 Dividend Scoring System
| Category | Score | Indicator |
|---|---|---|
| Dividend Yield | 4 | |
| Dividend Stability | 5 | |
| Dividend Growth | 3 | |
| Payout Ratio | 2 | |
| Financial Stability | 3 | |
| Dividend Continuity | 5 | |
| Cashflow Coverage | 3 | |
| Balance Sheet Quality | 3 |
Overall Score: 28 out of 40
✅ Rating
The Williams Companies, Inc., with its history of extensive and stable dividend payments, is an appealing choice for investors seeking steady income. While its dividend payout ratios warrant careful monitoring, the company's robust sector standing and solid historical performance offer a reliable option for dividend-focused portfolios.