March 11, 2026 a 07:31 am

WMB: Dividend Analysis - The Williams Companies, Inc.
The Williams Companies, Inc. demonstrates a resilient and consistent dividend history with a robust decade-long payout strategy, appealing to income-focused investors. Despite its high payout ratios, which may raise red flags, the company's fortified dividend growth spotlight promises moderate yet persistent shareholder returns. Continued growth and stability are anticipated, stemming from its strategic sector positioning.
Overview
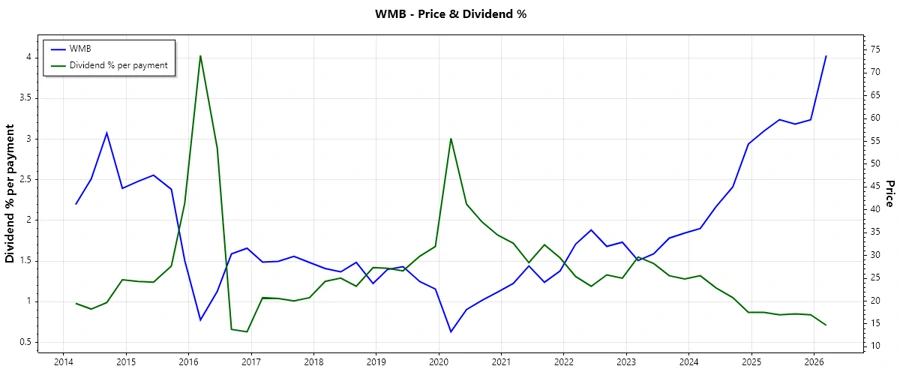
The Williams Companies operates within the Energy sector, offering an enticing dividend yield coupled with a substantial historical track record of consistent payouts. The data underscores a remarkable 45-year history of uninterrupted dividend payments, reflecting the company's fortitude and investor commitment.
| Metric | Detail |
|---|---|
| Sector | Energy |
| Dividend Yield | 2.74% |
| Current Dividend Per Share | 2 USD |
| Dividend History | 45 years |
| Last Cut or Suspension | None |
Dividend History
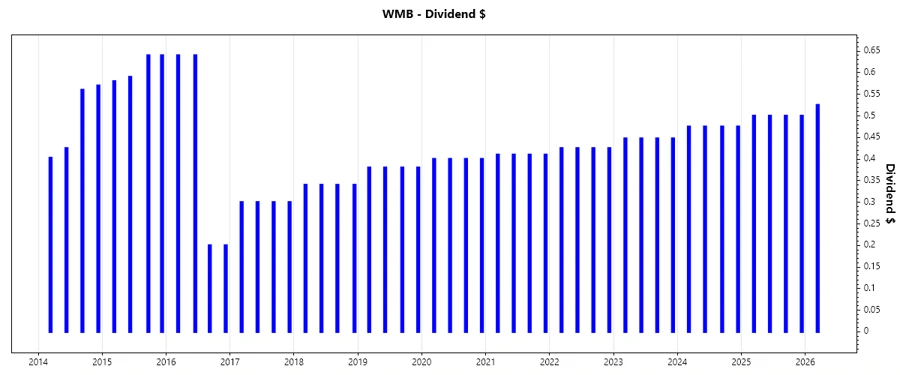
The dividend history exemplifies the reliability and consistency in providing shareholder value, critical for long-term income strategy holders. Such historical data not only enhances investor confidence but also demonstrates the company's strong financial discipline.
| Year | Dividend Per Share (USD) |
|---|---|
| 2026 | 0.525 |
| 2025 | 2.0 |
| 2024 | 1.9 |
| 2023 | 1.79 |
| 2022 | 1.7 |
Dividend Growth
Historical dividend growth is a critical consideration for assessing future earning potential and financial health. The data shows that dividend growth over 3 years is 5.57% and over 5 years is 4.56%, indicating moderate but sustainable enhancement in shareholder value.
| Time | Growth |
|---|---|
| 3 years | 5.57% |
| 5 years | 4.56% |
The average dividend growth is 4.56% over 5 years. This shows moderate but steady dividend growth, indicating potential for continued upward momentum in dividends.
Payout Ratio
Payout ratio insights serve as a measure of dividend sustainability. The high EPS-based payout ratio of 93.35% suggests vulnerability in profit coverage, while an even higher Free Cash Flow-based ratio of 271.76% highlights potential cash flow hindrances, necessitating caution.
| Key Figure | Ratio |
|---|---|
| EPS-based | 93.35% |
| Free cash flow-based | 271.76% |
Such high payout ratios raise concerns about future dividend sustainability without enhanced earnings growth or cash flow management.
Cashflow & Capital Efficiency
Assessing free cash flow yield and capital efficiency offers insight into a company's operational effectiveness and long-term viability. The tables below elaborate metrics like Free Cash Flow Yield and Earnings Yield. Higher CAPEX to Operating Cash Flow suggests significant reinvestment, requiring careful assessment for long-term returns.
| Metric | 2025 | 2024 | 2023 |
|---|---|---|---|
| Free Cash Flow Yield | 1.37% | 3.64% | 7.95% |
| Earnings Yield | 3.57% | 3.37% | 7.49% |
| CAPEX to Operating Cash Flow | 84.76% | 51.72% | 43.23% |
| Stock-based Compensation to Revenue | 0% | 0.94% | 0.71% |
| Free Cash Flow / Operating Cash Flow Ratio | 17.04% | 48.27% | 56.77% |
The stability of cash flow and efficient capital allocation are pivotal for sustaining growth and covering future dividend payments.
Balance Sheet & Leverage Analysis
Leverage metrics like Debt-to-Equity and Debt-to-Assets are key indicators of financial robustness. Higher leverage amplifies risk but can also be an efficient capital use if returns exceed borrowing costs.
| Metric | 2025 | 2024 | 2023 |
|---|---|---|---|
| Debt-to-Equity | 229.26% | 217.75% | 213.37% |
| Debt-to-Assets | 50.13% | 49.66% | 50.28% |
| Debt-to-Capital | 69.63% | 68.53% | 68.09% |
| Net Debt to EBITDA | 3.95 | 4.11 | 3.15 |
| Current Ratio | 0.53 | 0.50 | 0.77 |
| Quick Ratio | 0.48 | 0.45 | 0.73 |
| Financial Leverage | 4.57 | 4.39 | 4.24 |
The company's leverage position highlights a significant reliance on debt, underscoring potential risks in volatile market conditions, but also potential high returns.
Fundamental Strength & Profitability
Analyzing return ratios like ROE and margins aids in evaluating operational efficiency and profitability. Sustainable returns signify wise management and potent growth vectors.
| Metric | 2025 | 2024 | 2023 |
|---|---|---|---|
| Return on Equity | 20.44% | 17.89% | 25.63% |
| Return on Assets | 4.47% | 4.08% | 6.04% |
| Margins: Net | 21.91% | 21.18% | 29.15% |
| EBIT Margin | 42.40% | 41.42% | 51.72% |
| EBITDA Margin | 62.04% | 62.54% | 70.71% |
| Gross Margin | 42.86% | 58.71% | 62.35% |
| R&D to Revenue | 0% | 0% | 0% |
The solid return metrics and robust margins underscore The Williams Companies' profitability prowess, generating healthy returns on equity and managed cost structures.
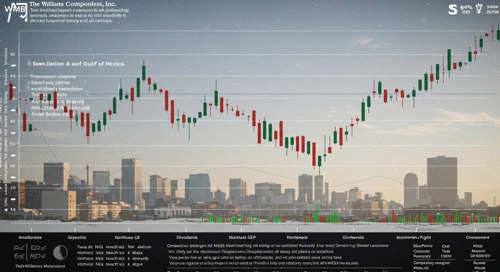
Price Development
Dividend Scoring System
A strategic evaluation using a dividend scoring system unveils investment attractiveness. Ratings across multiple categories yield comprehensive insights.
| Category | Score | Score Bar |
|---|---|---|
| Dividend Yield | 3 | |
| Dividend Stability | 5 | |
| Dividend Growth | 3 | |
| Payout Ratio | 2 | |
| Financial Stability | 3 | |
| Dividend Continuity | 5 | |
| Cashflow Coverage | 3 | |
| Balance Sheet Quality | 3 |
Overall Score: 27/40
Rating
Despite higher payout ratios indicating potential risks, The Williams Companies, Inc. remains a promising player with robust dividend history and consistent growth potential. It's suitable for investors seeking steady income with moderate capital appreciation potential in the long term.
Smart Data Insight
Master the Perfect Entry & Exit for this Stock
Don't leave your profits to chance. Historically, this stock follows specific seasonal patterns that institutional traders use to maximize returns.
- ✅ Identify the "Golden Buying Window"
- ✅ Avoid high-risk correction cycles
- ✅ Backtested data from the last 20+ years