December 10, 2025 a 02:46 am


WMB: Dividend Analysis - The Williams Companies, Inc.
The Williams Companies, Inc. has been a resilient player in the energy sector, demonstrating a stable dividend profile over the years. Its commitment to dividends is reflected in a steady payout of $1.90 per share, contributing to a respectable yield. However, high payout ratios raise sustainability concerns, particularly given an EPS-based ratio nearing 98% and a FCF-based at 129%. Despite past dividend cuts, the company's well-established history could instill dividend confidence backed by strong market engagement.
📊 Overview
Williams operates in the energy sector, offering a dividend yield of 3.25%, reflective of its current financial strategies. Boasting a 44-year dividend history, recent suspensions were noted in 2017. This consistency demonstrates commitment but also poses risks amidst high payout levels.
| Metric | Value |
|---|---|
| Sector | Energy |
| Dividend Yield | 3.25% |
| Current Dividend per Share | 1.90 USD |
| Dividend History | 44 Years |
| Last Cut or Suspension | 2017 |
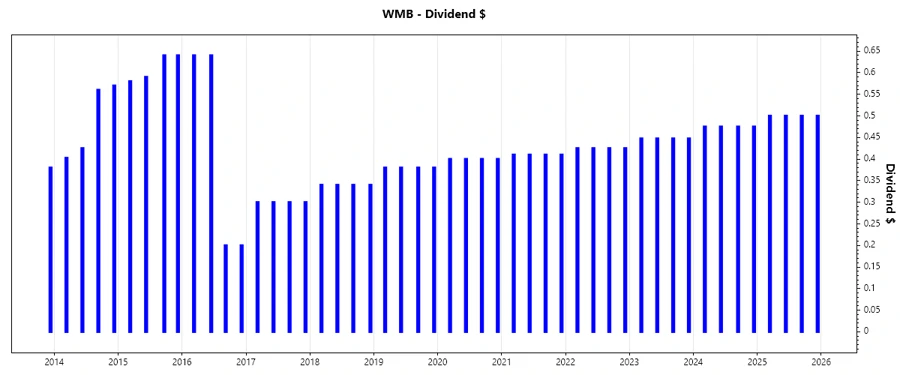
📉 Dividend History
Understanding dividend history is pivotal, providing insights into corporate commitments to shareholders. Here's how dividends have evolved lately:
| Year | Dividend per Share (USD) |
|---|---|
| 2025 | 2.00 |
| 2024 | 1.90 |
| 2023 | 1.79 |
| 2022 | 1.70 |
| 2021 | 1.64 |
📈 Dividend Growth
Dividend growth is a key indicator of financial strength and shareholder value. Evaluating growth over three and five years uncovers patterns of increase or stagnation:
| Time | Growth |
|---|---|
| 3 years | 5.03% |
| 5 years | 4.56% |
The average dividend growth rate is 4.56% over 5 years, indicating moderate but steady improvement.
✅ Payout Ratio
Evaluating payout ratios alongside EPS and cash flow metrics offers clarity on dividend sustainability. Excessively high ratios may indicate financial strain:
| Key Figure | Ratio |
|---|---|
| EPS-based | 97.95% |
| Free Cash Flow-based | 128.74% |
The EPS payout ratio at 97.95% suggests potential liquidity issues, while a 128.74% FCF ratio raises alarms regarding cash flow coverage.
💰 Cashflow & Capital Efficiency
Cashflow and capital allocation efficiency are critical in maintaining dividend sustainability and indicating profitability margins.
| Metric | 2022 | 2023 | 2024 |
|---|---|---|---|
| Free Cash Flow Yield | 6.50% | 7.95% | 3.64% |
| Earnings Yield | 5.11% | 7.49% | 3.37% |
| CAPEX to Operating Cash Flow | 0.47 | 0.43 | 0.52 |
| Stock-based Compensation to Revenue | 0.67% | 0.71% | 0.94% |
| Free Cash Flow / Operating Cash Flow | 53.30% | 56.77% | 48.27% |
Recent metrics show robust cash flows with stable free cash flow generation, crucial for dividend funding.
🗣️ Balance Sheet & Leverage Analysis
A solid balance sheet underpins financial resilience, and managing leverage assures longer-term viability through economic cycles.
| Metric | 2022 | 2023 | 2024 |
|---|---|---|---|
| Debt-to-Equity | 199.43% | 213.37% | 217.75% |
| Debt-to-Assets | 47.29% | 50.28% | 49.66% |
| Debt-to-Capital | 66.60% | 68.09% | 68.53% |
| Net Debt to EBITDA | 4.00 | 3.15 | 4.11 |
| Current Ratio | 0.77 | 0.77 | 0.50 |
| Quick Ratio | 0.71 | 0.73 | 0.45 |
| Financial Leverage | 4.22 | 4.24 | 4.39 |
The high debt-to-equity ratios indicate significant leverage, necessitating careful management of capital to sustain dividends.
📈 Fundamental Strength & Profitability
Understanding core profitability and efficiency ratios aids in assessing whether a company can generate sufficient returns for its investors.
| Metric | 2022 | 2023 | 2024 |
|---|---|---|---|
| Return on Equity | 17.84% | 25.63% | 17.89% |
| Return on Assets | 4.23% | 6.04% | 4.08% |
| Net Profit Margin | 18.69% | 29.15% | 21.18% |
| Gross Profit Margin | 50.15% | 62.35% | 58.71% |
| EBIT Margin | 33.64% | 51.72% | 41.42% |
| EBITDA Margin | 51.97% | 70.71% | 62.54% |
While profitability metrics are strong, indicating sound management, potential volatile conditions still pose risks to continuity.
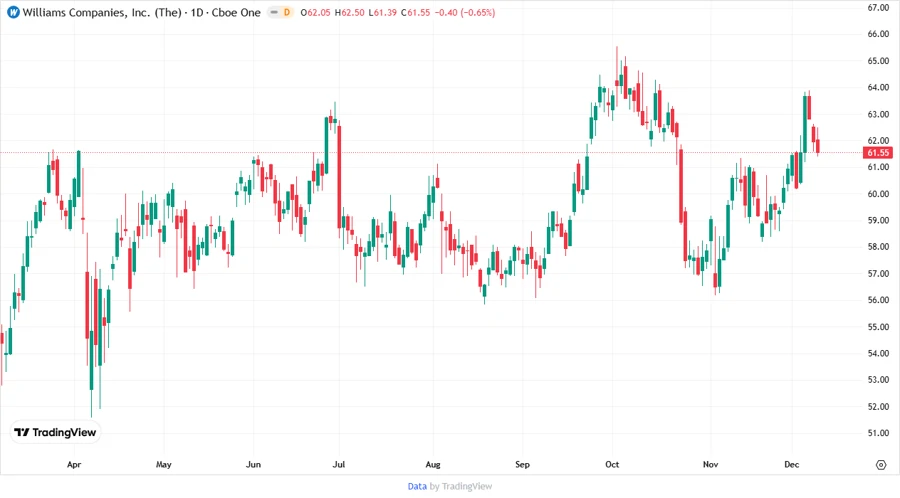
📉 Price Development
🔍 Dividend Scoring System
| Category | Score (1-5) | Score Bar |
|---|---|---|
| Dividend Yield | 4 | |
| Dividend Stability | 3 | |
| Dividend Growth | 3 | |
| Payout Ratio | 2 | |
| Financial Stability | 2 | |
| Dividend Continuity | 3 | |
| Cashflow Coverage | 3 | |
| Balance Sheet Quality | 2 |
Total Score: 22/40
Rating
In conclusion, The Williams Companies, Inc. presents a mixed outlook for dividend investors. While the yield is attractive and historical continuity provides some assurance, the high payout ratios and leverage require careful monitoring. Investors should be cautious and consider the company's capacity to manage its obligations while ensuring dividend payments. Given these factors, a moderate to cautious rating is recommended for dividend-focused portfolios.