February 13, 2026 a 10:15 am

WFC: Fibonacci Analysis - Wells Fargo & Company
Wells Fargo & Company, a cornerstone in diversified financial services, exhibits a robust presence in banking, mortgage, and investment domains. With its extensive service portfolio, Wells Fargo caters to both consumer and commercial needs, making it a vital player in the financial sector. However, recent stock trends prompt investors to proceed with caution amidst volatile market conditions, reflecting broader economic uncertainties.
Fibonacci Analysis
| Parameter | Details |
|---|---|
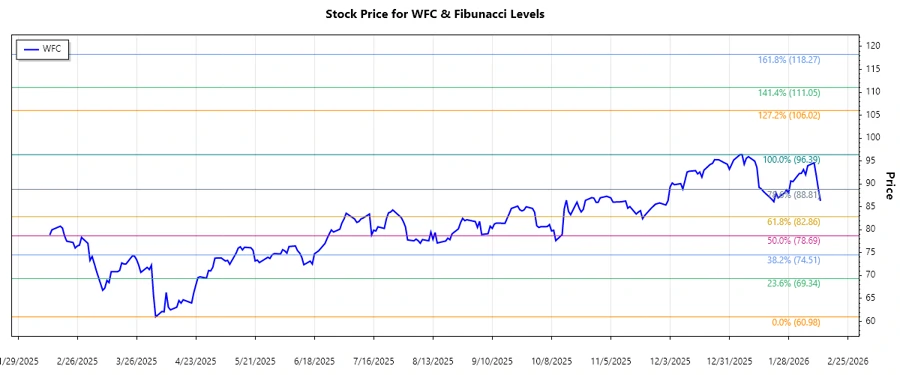
| Trend Start Date | 2025-04-01 |
| Trend End Date | 2026-02-09 |
| High Point | 96.39 on 2026-01-06 |
| Low Point | 60.98 on 2025-04-04 |
| Fibonacci Level | Price Level |
|---|---|
| 0.236 | 72.4122 |
| 0.382 | 78.0684 |
| 0.5 | 82.695 |
| 0.618 | 87.3216 |
| 0.786 | 92.9616 |
The current stock price is 86.29, which hovers around the 0.618 Fibonacci retracement level. This suggests a potential support level for the stock. Technically, if the price sustains above this level, it indicates strength, whereas a fall below may hint at further decline towards lower levels.
Conclusion
Wells Fargo's recent trend shows a notable recovery from its lows in April 2025 to highs in early 2026, highlighting resilience in its stock dynamics. Analysts should monitor key retracement levels closely, as they indicate potential support and breakthrough areas. A break above the 0.618 level may see further upward momentum, while a failure to hold can lead to challenges. Investors must weigh these technical insights against macroeconomic factors, considering the bank's substantial market impact and economic reliance. Balancing these variables, the stock still shows promise for gradual progression amid financial sector fluctuations.