February 03, 2026 a 11:44 am
WFC: Fibunacci Analysis - Wells Fargo & Company
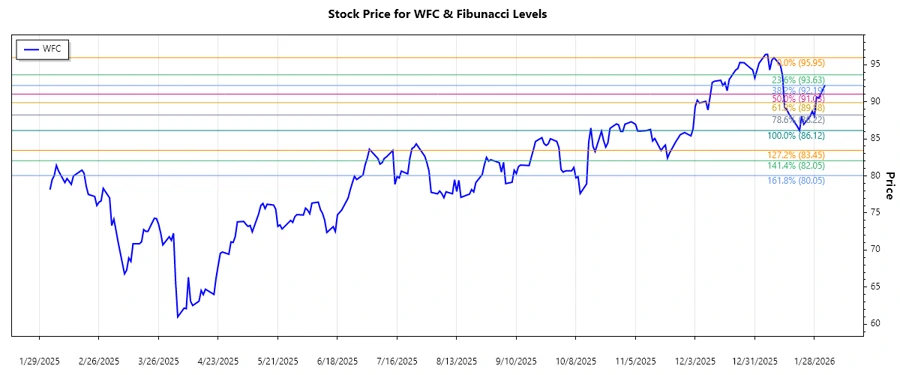
Wells Fargo & Company, operating in a diverse financial industry with a solid foundation in banking and investment services, has recently exhibited a downward trend. This shift could have implications on investor sentiment, potentially opening opportunities for those looking to enter at lower price points. However, it also warrants caution as the stock navigates through economic uncertainties and regulatory influences. This technical analysis aims to provide a clearer understanding of critical levels that could indicate potential turning points.
Fibonacci Analysis
The recent trend for Wells Fargo & Company shows a notable downward movement. This trend provides a basis for the Fibonacci retracement analysis to identify potential price reversal levels.
| Detail | Value |
|---|---|
| Trend Start Date | 2025-12-09 |
| Trend End Date | 2026-02-02 |
| High Point (Date & Price) | 2025-12-09: $95.95 |
| Low Point (Date & Price) | 2026-02-02: $86.12 |
Fibonacci Levels
| Level | Price |
|---|---|
| 0.236 | $93.39 |
| 0.382 | $92.09 |
| 0.5 | $91.04 |
| 0.618 | $89.99 |
| 0.786 | $88.38 |
The current price is closely aligned with the 0.786 Fibonacci retracement level, deviating slightly around the $88.38 mark, indicating potential support in this region.
Technical interpretation suggests that if the price consistently holds above the 0.786 level, a potential reversal or consolidation pattern might emerge, signifying a possible point of accumulation for investors.
Conclusion
Wells Fargo & Company has been experiencing a downtrend, with significant activity around specific Fibonacci retracement levels. The current stock position around 0.786 could present an opportunity for investors to evaluate entry points. However, market volatility and external economic factors should be carefully assessed. The technical signals indicate that a solid base could form around current levels, presenting potential buying opportunities. Analysts should remain vigilant to changes in trend dynamics, particularly with regards to economic indicators and regulatory changes that could impact financial services. Maintaining a proactive approach to risk management and closely monitoring key support and resistance levels will be crucial for navigating this stock's performance.