November 10, 2025 a 04:46 pm
WFC: Fibonacci Analysis - Wells Fargo & Company
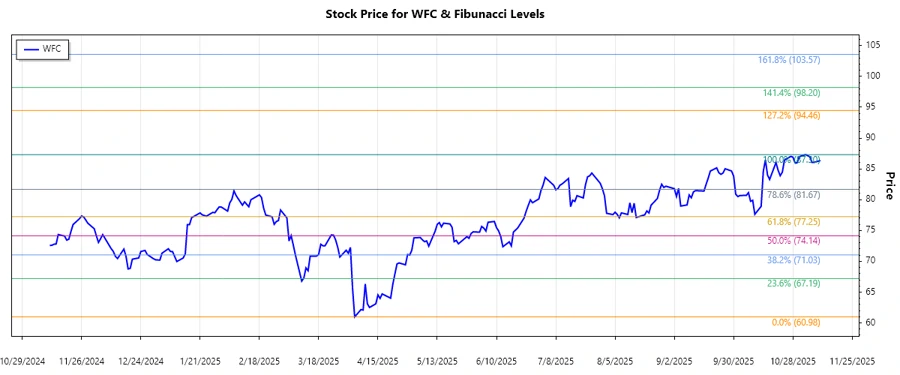
Wells Fargo & Company has experienced significant fluctuations in its stock price, with a clear trend emerging in the last months analyzed. With its diverse financial service offerings, the company remains a key player in the financial sector. Investors should be aware of the recent trends and Fibonacci levels as potential indicators of future price movements.
Fibonacci Analysis
| Trend Period | High | Low | Current Price | Retracement Levels |
|---|---|---|---|---|
| 2024-11-11 to 2025-11-10 | $87.3 (2025-11-03) | $60.98 (2025-04-04) | $86.35 (2025-11-10) |
|
Currently, WFC is trading outside the Fibonacci retracement zones, confirming its persistent upward momentum. The levels of $77.50 and $82.55 provide significant support zones in case of a pullback.
Conclusion
The Wells Fargo & Company stock exhibits a strong upward trend, indicating positive investor sentiment and potential continuation of growth. However, the presence of resistance near the $87.3 high could lead to short-term fluctuations. Important Fibonacci retracement levels serve as potential areas for support, providing safety nets should the stock experience a pullback. Investors should watch these levels closely for potential entry points or signals of a trend reversal.
Smart Data Insight
Master the Perfect Entry & Exit for this Stock
Don't leave your profits to chance. Historically, this stock follows specific seasonal patterns that institutional traders use to maximize returns.
- ✅ Identify the "Golden Buying Window"
- ✅ Avoid high-risk correction cycles
- ✅ Backtested data from the last 20+ years