August 29, 2025 a 10:15 am

WFC: Fibonacci Analysis - Wells Fargo & Company
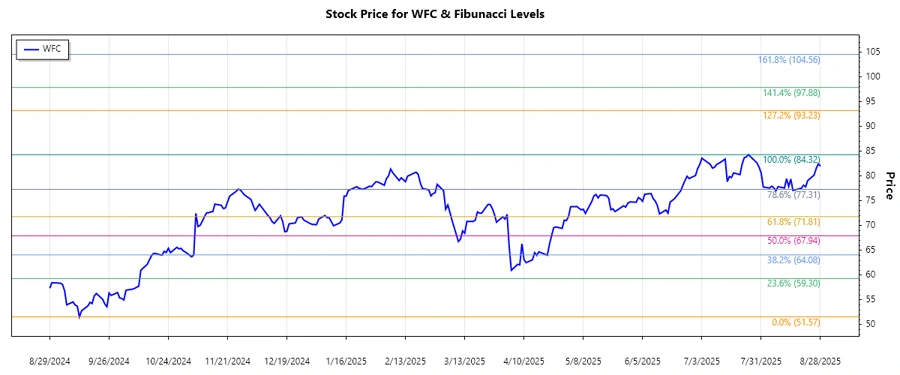
Wells Fargo & Company has experienced a significant upward trend over the analyzed period. This trend reflects the company's strategic initiatives and favorable market conditions. The stock has shown resilience, making it a focus for investors looking for potential gains. Analyzing the recent price patterns reveals critical retracement levels that could serve as potential support or resistance in the near future.
Fibonacci Analysis
| Parameter | Details |
|---|---|
| Trend Start Date | 2024-09-12 |
| Trend End Date | 2025-08-28 |
| High Price | $84.32 (2025-07-25) |
| Low Price | $51.57 (2024-09-12) |
| Fibonacci Levels |
|
| Current Price | $81.98 |
| Retracement Zone | None (Above 0.786 Level) |
| Technical Interpretation | The current price is above the key Fibonacci retracement levels, indicating strong upward momentum and potential resistance near the high. |
Conclusion
The Wells Fargo & Company stock has shown a solid upward trend with significant gains over the analyzed period. The current price hovering above the 78.6% Fibonacci retracement suggests robust market sentiment and potential for further upside. However, investors might need to be cautious of possible resistance at previous highs. The company's diversified portfolio and sound financial footing contribute to its appeal, but market volatility could pose risks. Technical analysts should watch for price action near the Fibonacci levels to identify potential support zones.
Smart Data Insight
Master the Perfect Entry & Exit for this Stock
Don't leave your profits to chance. Historically, this stock follows specific seasonal patterns that institutional traders use to maximize returns.
- ✅ Identify the "Golden Buying Window"
- ✅ Avoid high-risk correction cycles
- ✅ Backtested data from the last 20+ years