
June 12, 2026 a 11:31 am

WFC: Dividend Analysis - Wells Fargo & Company
Wells Fargo & Company, a stalwart in the financial sector, presents a dividend yield of 2.38%. With an impressive 55-year dividend history and a minimal recent cut or suspension, the firm offers both reliability and moderate growth. The EPS payout ratio remains sustainable, though free cash flow coverage warrants attention. Overall, the stock appeals to dividend-seekers prioritizing endurance and moderate income growth.
📊 Overview
Wells Fargo operates in the Financial sector with a current dividend yield of 2.38%. The company dispenses a dividend per share of $2.04, underscoring a robust dividend history of 55 years with no recent cuts or suspensions.
| Sector | Dividend Yield | Current Dividend per Share | Dividend History | Last Cut or Suspension |
|---|---|---|---|---|
| Financial | 2.38 % | 2.04 USD | 55 years | None |
📈 Dividend History
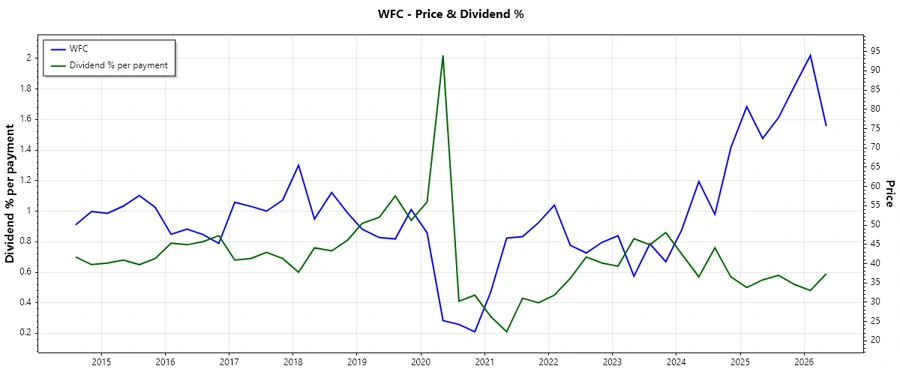
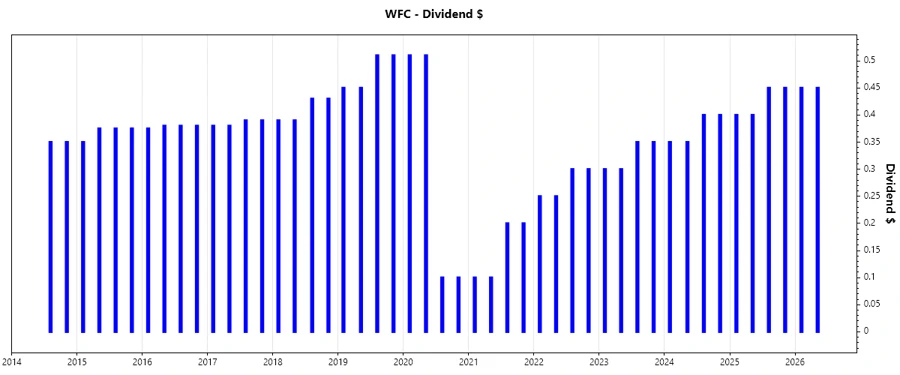
The company boasts a lengthy 55-year streak of dividends, a testament to its established financial practices. This historical consistency is crucial for investors relying on steady income, offering a strategic buffer against market volatilities.
| Year | Dividends Per Share (USD) |
|---|---|
| 2026 | 0.90 |
| 2025 | 1.70 |
| 2024 | 1.50 |
| 2023 | 1.30 |
| 2022 | 1.10 |
📊 Dividend Growth
Wells Fargo exhibits a moderate dividend growth trajectory with a 3-year growth rate of 0.16% and a 5-year growth rate of 0.07%. These figures indicate a consistent yet conservative growth strategy.
| Time | Growth |
|---|---|
| 3 years | 15.62% |
| 5 years | 6.86% |
The average dividend growth is 6.86% over 5 years. This shows moderate but steady dividend growth.
📉 Payout Ratio
The EPS-based payout ratio at 29.83% showcases healthy dividend support from earnings, though the Free Cash Flow-based ratio at 529.39% suggests caution, as it indicates challenges in FCF coverage of dividends, which could affect long-term payout sustainability.
| Key Figure | Ratio |
|---|---|
| EPS-based | 29.83 % |
| Free cash flow-based | 529.39 % |
✅ Cashflow & Capital Efficiency
Specific attention must be given to the Free Cash Flow Yield, which offers a minuscule return and challenges the dividend sustainability in the long run. Meanwhile, the persistent capital efficiency ratings, including Earnings Yield and the CAPEX to Operating Cash Flow ratio of 0, indicate a cautious but stable capital utilization strategy.
| Year | 2023 | 2024 | 2025 |
|---|---|---|---|
| Free Cash Flow Yield | 22.23% | 1.26% | -6.41% |
| Earnings Yield | 10.54% | 8.20% | 7.20% |
| CAPEX to Operating Cash Flow | 0% | 0% | 0% |
| Stock-based Compensation to Revenue | 0% | 0% | 0% |
| Free Cash Flow / Operating Cash Flow Ratio | 1.00 | 1.00 | 1.00 |
⚠️ Balance Sheet & Leverage Analysis
The company's debt structure, with its high Debt-to-Equity ratio of 2.35 and Financial Leverage at 11.86, requires prudent management to ensure continued financial stability and liquidity. A below-average Current Ratio indicates potential risks in meeting short-term liabilities.
| Year | 2023 | 2024 | 2025 |
|---|---|---|---|
| Debt-to-Equity | 1.60 | 1.57 | 2.35 |
| Debt-to-Assets | 15.38% | 14.61% | 19.81% |
| Debt-to-Capital | 61.54% | 61.15% | 70.15% |
| Net Debt to EBITDA | 2.15 | 2.54 | 8.73 |
| Current Ratio | 0.29 | 0.27 | 0.34 |
| Quick Ratio | 0.29 | 0.27 | 0.29 |
| Financial Leverage | 10.40 | 10.77 | 11.86 |
Fundamental Strength & Profitability
The profitability metrics such as Return on Assets and Equity indicate modest profitability. Gross margins remain high, reflecting effective cost management strategies. However, Return on Invested Capital stays relatively low, suggesting scope for improvement in profitability from investments.
| Year | 2023 | 2024 | 2025 |
|---|---|---|---|
| Return on Equity | 10.31% | 11.01% | 11.78% |
| Return on Assets | 0.99% | 1.02% | 0.99% |
| Margins: Net | 16.60% | 15.73% | 17.27% |
| Margins: EBIT | 18.76% | 18.63% | 20.40% |
| Margins: EBITDA | 24.20% | 24.66% | 23.76% |
| Margins: Gross | 66.93% | 62.17% | 64.80% |
| R&D to Revenue | 0% | 0% | 0% |
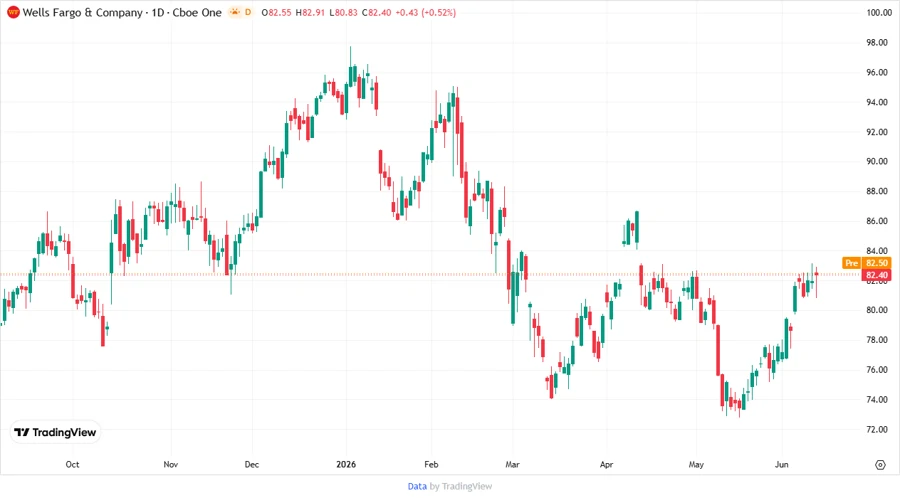
Price Development
Dividend Scoring System
| Category | Score/5 | Score Bar |
|---|---|---|
| Dividend yield | 4 | |
| Dividend Stability | 5 | |
| Dividend growth | 3 | |
| Payout ratio | 2 | |
| Financial stability | 3 | |
| Dividend continuity | 5 | |
| Cashflow Coverage | 2 | |
| Balance Sheet Quality | 3 |
Total Score: 27/40
🗣️ Rating
Wells Fargo & Company's robust dividend legacy, complemented by consistent, albeit moderate growth and stable financial metrics, results in an overall commendable dividend profile. It remains a reliable choice for investors prioritizing dependable income streams. The recommendation is to maintain or consider accumulating at weakness, given potential challenges in cash flow coverage of dividends.
Smart Data Insight
Master the Perfect Entry & Exit for this Stock
Don't leave your profits to chance. Historically, this stock follows specific seasonal patterns that institutional traders use to maximize returns.
- ✅ Identify the "Golden Buying Window"
- ✅ Avoid high-risk correction cycles
- ✅ Backtested data from the last 20+ years