March 17, 2026 a 07:31 am

WFC: Dividend Analysis - Wells Fargo & Company
Wells Fargo & Company exhibits a decent dividend yield coupled with a notable history of consistent dividend payments. While the dividend growth has shown moderate increases over the past five years, the underlying payout ratios suggest a cautious but viable strategy to sustain dividends amidst financial challenges.
📊 Overview
Wells Fargo & Company is a major financial services provider in the sector with a robust dividend yield and a long-standing history of dividend payments. Let's delve into the key dividend indicators below:
| Metric | Value |
|---|---|
| Sector | Financial Services |
| Dividend Yield | 1.86 % |
| Current Dividend Per Share | 2.04 USD |
| Dividend History | 55 years |
| Last Cut or Suspension | None |
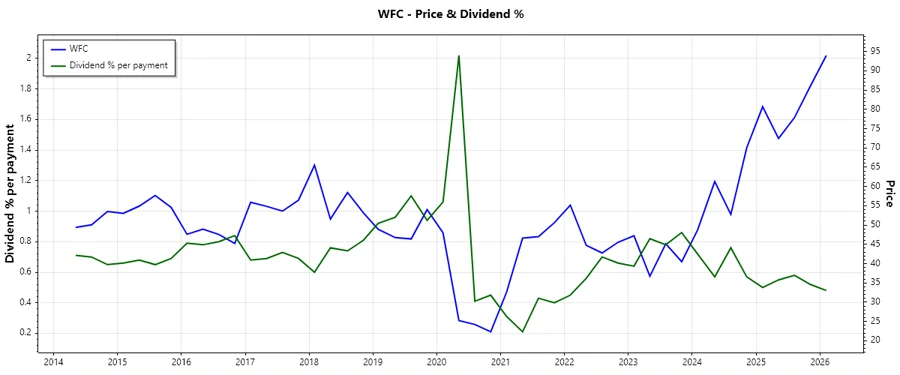
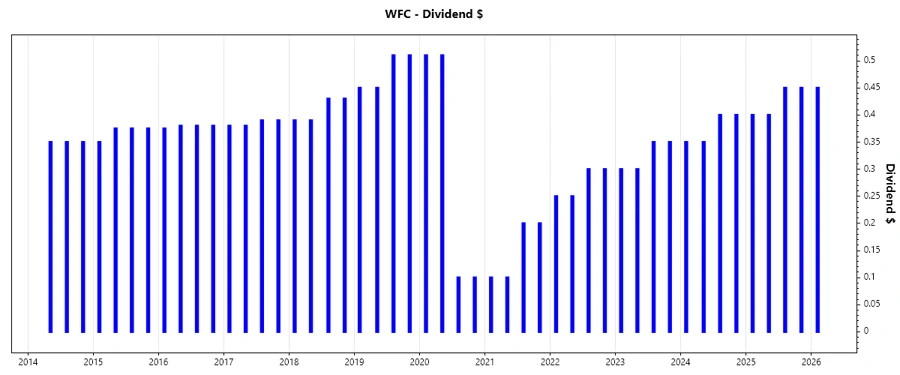
📈 Dividend History
The dividend history of a company reflects its ability to provide sustainable returns to shareholders over time. Wells Fargo's track record is commendable with consistent payments.
| Year | Dividend Per Share |
|---|---|
| 2026 | 0.45 USD |
| 2025 | 1.70 USD |
| 2024 | 1.50 USD |
| 2023 | 1.30 USD |
| 2022 | 1.10 USD |
📊 Dividend Growth
Assessing dividend growth provides insights into future expectations. Here, we evaluate the growth over three and five years, illustrating Wells Fargo's capacity to augment dividend distributions.
| Time | Growth |
|---|---|
| 3 years | 15.62 % |
| 5 years | 6.86 % |
The average dividend growth is 6.86 % over 5 years. This shows moderate but steady dividend growth.
📉 Payout Ratio
The payout ratio illustrates the proportions of earnings and free cash flow allocated to dividends, essential for understanding sustainability. A careful balance is required to ensure continued growth and investor returns while maintaining fiscal health.
| Key figure | Ratio |
|---|---|
| EPS-based | 30.39 % |
| Free Cash Flow-based | -33.69 % |
The payout ratio of 30.39 % (EPS) indicates a conservative approach, ensuring room for reinvestment. Conversely, the negative free cash flow payout ratio suggests cash flow challenges necessitating future operational improvements.
🔄 Cashflow & Capital Efficiency
Solid cash flow and efficient capital use are critical for sustaining dividend strategies. Here we evaluate Wells Fargo's financial health and ability to generate free cash flow.
| Metric | 2023 | 2024 | 2025 |
|---|---|---|---|
| Free Cash Flow Yield | 22.23 % | 1.26 % | -6.41 % |
| Earnings Yield | 10.54 % | 8.20 % | 7.20 % |
| CAPEX to Operating Cash Flow | 0 % | 0 % | 0 % |
| Stock-based Comp. to Revenue | 0 % | 0 % | 0 % |
| FCF/Operating Cash Flow Ratio | 1 | 1 | 1 |
While the earnings yield indicates profitability, the fluctuating free cash flow yield needs addressing to fortify dividend coverage.
📊 Balance Sheet & Leverage Analysis
Evaluating leverage and liquidity through ratios is pivotal for assessing Wells Fargo's financial resilience, particularly in volatile markets.
| Metric | 2023 | 2024 | 2025 |
|---|---|---|---|
| Debt-to-Equity | 1.60 | 1.57 | 2.35 |
| Debt-to-Assets | 15.38 % | 14.61 % | 19.81 % |
| Debt-to-Capital | 61.54 % | 61.15 % | 70.15 % |
| Net Debt to EBITDA | 2.15 | 2.54 | 8.57 |
| Current Ratio | 0.29 | 0.27 | 0.29 |
| Quick Ratio | 0.29 | 0.27 | 0.29 |
High financial leverage indicates dependency on borrowed capital to sustain operations, alongside the succession of stringent financial conditions.
✅ Fundamental Strength & Profitability
Profitability metrics reveal the core performance efficiency of Wells Fargo, vital for determining ongoing dividend viability.
| Metric | 2023 | 2024 | 2025 |
|---|---|---|---|
| Return on Equity | 10.31 % | 11.01 % | 11.78 % |
| Return on Assets | 0.99 % | 1.02 % | 0.99 % |
| Net Margin | 16.60 % | 15.73 % | 17.27 % |
| EBIT Margin | 18.76 % | 18.63 % | 20.40 % |
| EBITDA Margin | 24.20 % | 24.66 % | 23.76 % |
| Gross Margin | 66.93 % | 62.17 % | 64.80 % |
The robust Return on Equity highlights shareholder profitability, supported further by strong gross margins, fortifying dividend issuance capabilities.
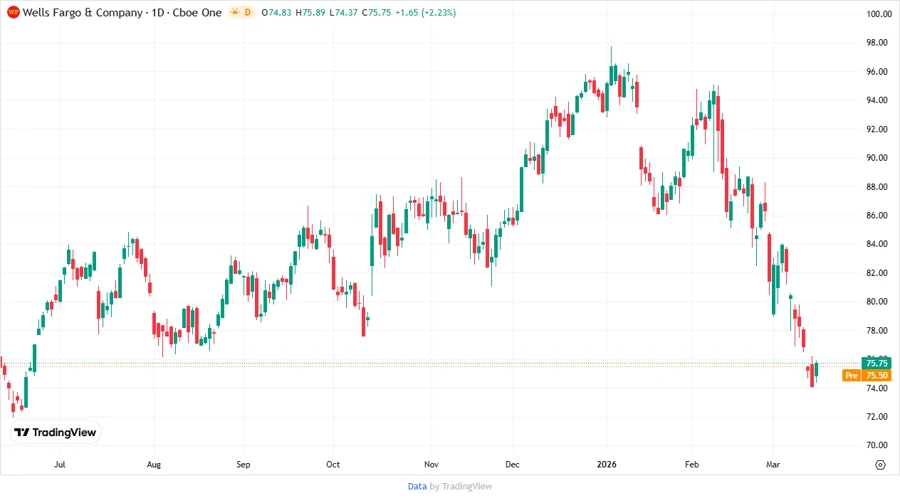
📉 Price Development
📊 Dividend Scoring System
An individualized scoring system offers a quick reference of key dividend metrics, each category rated from 1 to 5.
| Category | Score | |
|---|---|---|
| Dividend Yield | 3 | |
| Dividend Stability | 4 | |
| Dividend Growth | 3 | |
| Payout Ratio | 3 | |
| Financial Stability | 2 | |
| Dividend Continuity | 5 | |
| Cashflow Coverage | 2 | |
| Balance Sheet Quality | 3 |
Total Score: 25/40
🗣️ Rating
Wells Fargo & Company presents itself as a resilient dividend stock with a secure yield and exceptional continuity. Notably, prudent financial oversight is suggested to enhance metrics such as free cash flow yield and leverage ratios, which are crucial for long-term investor confidence. Moderate to conservative investors may find it an appealing component of a diversified portfolio for steady income potential.