December 03, 2025 a 12:46 pm

WFC: Dividend Analysis - Wells Fargo & Company
Wells Fargo & Company, a stalwart in the banking sector, shows a relatively strong dividend history with a 54-year streak. However, recent years have highlighted some volatility, particularly with a dividend cut in 2021. Investors may find the current dividend yield attractive, but the negative dividend growth rate over the past five years warrants caution. The company's payout ratios are modest, suggesting there's room for safe dividend maintenance, though negative free cash flow raises concerns about long-term sustainability.
📊 Overview
Wells Fargo & Company operates within the Financial sector, maintaining a consistent dividend yield of 1.98%. With a solid history of paying dividends for 54 years, this company remains a reliable choice for income-focused investors. However, the last cut in 2021 is a reminder of its susceptibility to broad economic impacts. Here’s a brief overview:
| Key Metrics | Details |
|---|---|
| Sector | Financial |
| Dividend Yield | 1.98% |
| Current Dividend per Share | 1.82 USD |
| Dividend History | 54 years |
| Last Cut or Suspension | 2021 |
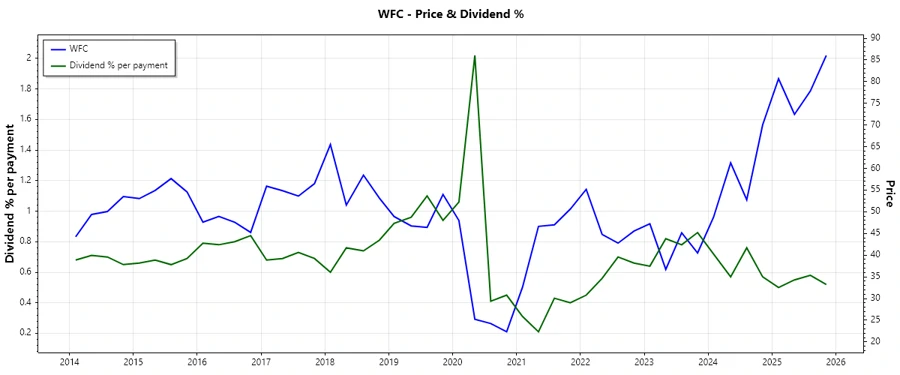
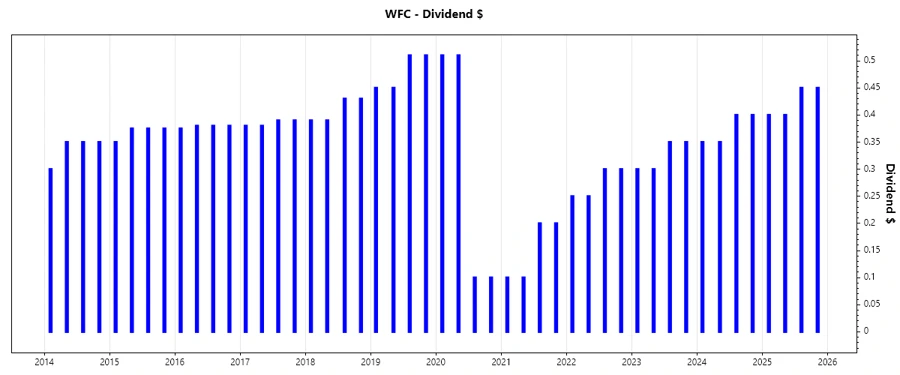
🗣️ Dividend History
The dividend history of Wells Fargo & Company reflects its commitment to shareholder returns, yet recent years have implied caution with scaled-down commitments. The dividend cuts underscore potential vulnerabilities to macroeconomic conditions, but overall, the company has shown resilience for decades.
| Year | Dividend per Share (USD) |
|---|---|
| 2025 | 1.70 |
| 2024 | 1.50 |
| 2023 | 1.30 |
| 2022 | 1.10 |
| 2021 | 0.60 |
📈 Dividend Growth
Dividend growth serves as an indicator of a company's financial health and management's confidence in its earnings trajectory. Wells Fargo has seen mixed results with a 3-year growth rate of 0.36% and a concerning 5-year decline at -4.82%, reflecting past operational challenges and a response to external financial pressures.
| Time | Growth |
|---|---|
| 3 years | 0.36% |
| 5 years | -4.82% |
The average dividend growth is -4.82% over 5 years. This shows moderate but steady dividend growth.
📉 Payout Ratio
Payout ratios are crucial in assessing whether a company's earnings can sustainably support its dividend. Wells Fargo's EPS-based payout ratio is moderate at 27.46%, indicating potential for safe dividends. However, the negative free cash flow payout ratio highlights liquidity issues that could impact future payouts.
| Key figure ratio | Percentage |
|---|---|
| EPS-based | 27.46% |
| Free cash flow-based | -41.60% |
The payout ratios present a mixed picture. While the EPS-based payout ratio is reassuring, the FCF-based ratio suggests that current dividends might not be sustainable without improvements in cash flow.
✅ Cashflow & Capital Efficiency
Strength in cash flow is vital for sustaining dividends and fueling growth. Despite a negative free cash flow yield (-5.07%), Wells Fargo's earnings yield stands at 7.67%, reflecting strong profitability amidst capital allocation challenges.
| Metric | 2024 | 2023 | 2022 |
|---|---|---|---|
| Free Cash Flow Yield | 1.26% | 22.23% | 17.22% |
| Earnings Yield | 8.20% | 10.54% | 8.70% |
| CAPEX to Operating Cash Flow | 0 | 0 | 0 |
| Stock-based Compensation to Revenue | 0% | 0% | 0% |
| Free Cash Flow / Operating Cash Flow Ratio | 1 | 1 | 1 |
The cash flow metrics indicate challenges in capital efficiency, particularly in converting robust earnings yields into free cash flow, given the current financial leverage.
⚠️ Balance Sheet & Leverage Analysis
Evaluating the balance sheet reveals how leverage and liquidity may impact financial stability. With a debt-to-equity ratio of 1.57, Wells Fargo demonstrates significant leverage, but this is common and typically managed in the banking industry.
| Metric | 2024 | 2023 | 2022 |
|---|---|---|---|
| Debt-to-Equity | 1.57 | 1.60 | 1.25 |
| Debt-to-Assets | 0.15 | 0.15 | 0.12 |
| Debt-to-Capital | 0.61 | 0.62 | 0.56 |
| Net Debt to EBITDA | 2.54 | 2.15 | 2.98 |
| Current Ratio | 0.27 | 0.29 | 0.21 |
| Quick Ratio | 0.27 | 0.29 | 0.21 |
| Financial Leverage | 10.77 | 10.40 | 10.44 |
The leverage ratios underscore the firm's capability to manage its financial obligations, although it approaches a conservative threshold, amplifying the relevance of stable cash flow.
💪 Fundamental Strength & Profitability
Financial fundamentals like Return on Equity and Margins are pivotal for dividend sustenance. Wells Fargo's returns are consistently positive, but the pressure on margins highlights competitive industry strains and operational efficiency needs.
| Metric | 2024 | 2023 | 2022 |
|---|---|---|---|
| Return on Equity | 11.01% | 10.31% | 7.59% |
| Return on Assets | 1.02% | 0.99% | 0.73% |
| Net Margin | 15.73% | 16.60% | 16.39% |
| EBIT Margin | 18.63% | 18.76% | 18.73% |
| EBITDA Margin | 24.66% | 24.20% | 26.92% |
| Gross Margin | 62.17% | 66.93% | 87.29% |
| R&D to Revenue | 0% | 0% | 0% |
Despite consistent returns, the diminishing margins call for refined operational strategies. Without renewed focus, sustaining current growth levels could become challenging under prevailing competitive pressures.
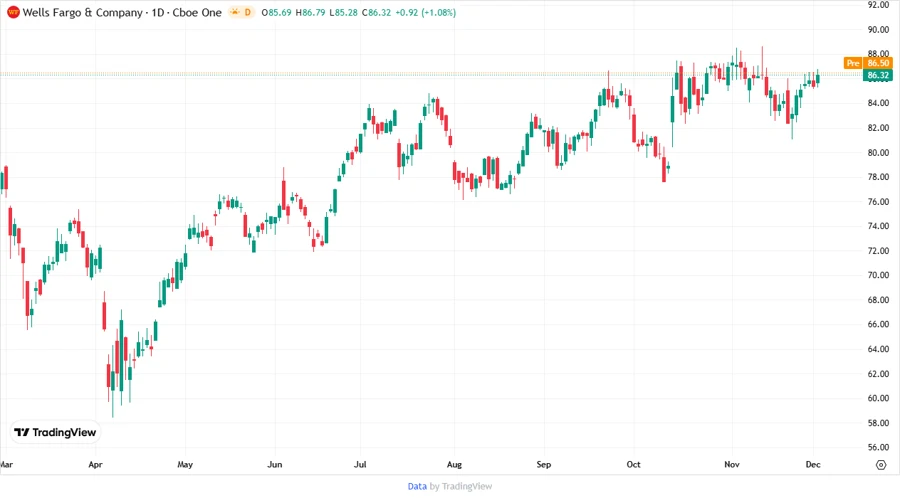
🏦 Price Development
🎯 Dividend Scoring System
| Criteria | Score | Score Bar |
|---|---|---|
| Dividend Yield | 3 | |
| Dividend Stability | 4 | |
| Dividend Growth | 2 | |
| Payout Ratio | 3 | |
| Financial Stability | 3 | |
| Dividend Continuity | 4 | |
| Cashflow Coverage | 2 | |
| Balance Sheet Quality | 3 |
Total Score: 24/40
🔍 Rating
In light of Wells Fargo & Company's historical dividend resilience and its current yield, the stock presents a moderate risk-reward profile. While the dividend history and payout ratio are strong, investors must weigh the challenges in negative cash flow and subdued growth trajectories. Thus, this stock is suitable for portfolio diversification rather than a standalone income strategy.