July 01, 2025 a 11:31 am

WFC: Dividend Analysis - Wells Fargo & Company
Wells Fargo & Company, an eminent banking institution, provides a compelling dividend profile highlighted by its substantial dividend history of 54 years without a cut. Despite the slight decline in the 5-year growth rate, Wells Fargo illustrates resilience in its current yield environment. Investors should be attentive to its relatively conservative payout ratios, indicating a secure dividend framework within its financial strategy supported by robust cash flow metrics.
📊 Overview
Wells Fargo & Company operates within the financial sector, known for its stability and essentiality across economic cycles. The firm exhibits a dividend yield of 2.21%, with a solid dividend per share standing at 1.70 USD. With a steadfast history of 54 consecutive dividend years, this reinforces Wells Fargo's commitment to returning capital to shareholders. The absence of recent dividend cuts or suspensions further attests to its financial robustness.
| Metric | Detail |
|---|---|
| Sector | Financial |
| Dividend yield | 2.21% |
| Current dividend per share | 1.70 USD |
| Dividend history | 54 years |
| Last cut or suspension | None |
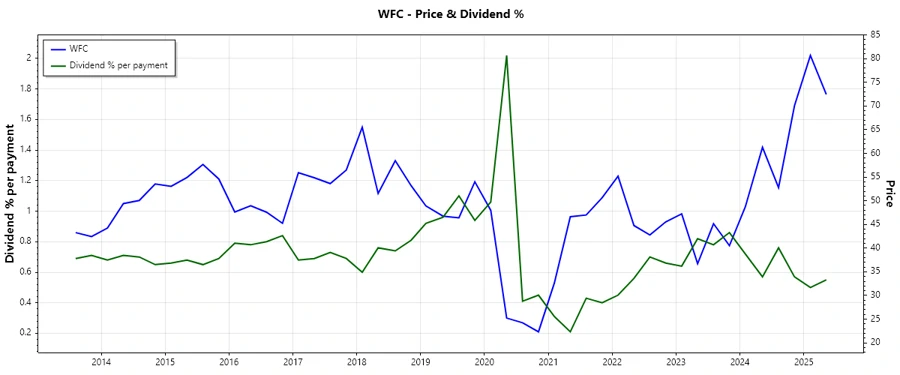
🗣️ Dividend History
Analyzing Wells Fargo's dividend history reveals a checklist of prolonged shareholder value distribution. It is vital as it illustrates the firm's capability and desire to reward its investors timely. This continually reassures stakeholder confidence, not only in prosperous periods but also during economic headwinds.
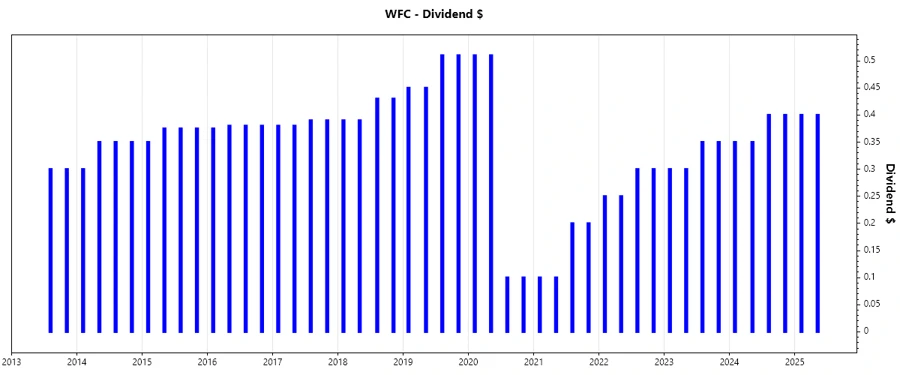
| Year | Dividend Per Share (USD) |
|---|---|
| 2025 | 0.80 |
| 2024 | 1.50 |
| 2023 | 1.30 |
| 2022 | 1.10 |
| 2021 | 0.60 |
📈 Dividend Growth
The dividend growth metrics are crucial for evaluating future dividend potential. Over the last 3 and 5 years, Wells Fargo's dividend growth experienced a slight contraction of -0.05%, which might signal caution or strategic adjustment aligned with broader operational goals.
| Time | Growth |
|---|---|
| 3 years | 0.36% |
| 5 years | -0.05% |
The average dividend growth is -0.05% over 5 years. This shows moderate but steady dividend growth.
✅ Payout Ratio
It is crucial to assess how much of the earnings are distributed as dividends, which reflects the sustainability and potential for dividend growth. The payout ratio based on earnings per share stands at 27.84%, a conservative level allowing for future retained earnings growth and flexibility. In contrast, free cash flow-based payout sits at a relatively high 133.93%, suggesting potential adjustments might be necessary for maintaining liquidity.
| Key figure | Ratio |
|---|---|
| EPS-based | 27.84% |
| Free cash flow-based | 133.93% |
The EPS-based payout ratio is considered prudent, reflecting strong profitability against modest dividend payout. The high FCF ratio, however, may signal potential over-distribution or cash allocation that needs alignment with operational cash flows.
⚠️ Cashflow & Capital Efficiency
Cash flow analysis provides insights into operational efficiency and capital utilization. The following metrics demonstrate the company's focus on optimizing cash flows relative to earnings and capital expenditures, imperative for sustaining dividend payouts.
| Year | 2024 | 2023 | 2022 |
|---|---|---|---|
| Free Cash Flow Yield | 1.18% | 22.23% | 17.22% |
| Earnings Yield | 7.65% | 10.54% | 8.70% |
| CAPEX to Operating Cash Flow | 0% | 0% | 0% |
| Stock-based Compensation to Revenue | 0% | 0% | 0% |
| Free Cash Flow / Operating Cash Flow Ratio | 1 | 1 | 1 |
The company exhibits stable free cash flow yields, aligning well with its demonstrated earnings yield. However, vigilance is suggested in CAPEX management to ensure variability does not impact cash flow stability, crucial in maintaining shareholder distributions.
📉 Balance Sheet & Leverage Analysis
Assessing leverage ratios provides a dimension of financial risk attributable to borrowing. These are indispensable for understanding the degree of leverage and the firm’s capability to meet its debt obligations.
| Year | 2024 | 2023 | 2022 |
|---|---|---|---|
| Debt-to-Equity | 1.57 | 1.60 | 1.25 |
| Debt-to-Assets | 0.15 | 0.15 | 0.12 |
| Debt-to-Capital | 0.61 | 0.62 | 0.56 |
| Net Debt to EBITDA | 2.54 | 2.15 | 2.98 |
| Current Ratio | 0.27 | 0.29 | 0.21 |
| Quick Ratio | 0.27 | 0.29 | 0.21 |
| Financial Leverage | 10.77 | 10.40 | 10.44 |
With relatively high leverage, Wells Fargo's capacity to service and amortize debt is meticulously managed. Liquidity ratios below 1 warrant close monitoring, suggesting potential adjustment needs for enhanced exposure management.
✅ Fundamental Strength & Profitability
Core profitability measures are integral for ensuring the firm's operational efficiency and profit potential, critical for sustaining dividends and long-term shareholder wealth.
| Year | 2024 | 2023 | 2022 |
|---|---|---|---|
| Return on Equity | 11.01% | 10.31% | 7.59% |
| Return on Assets | 1.02% | 0.99% | 0.73% |
| Margins: Net | 15.73% | 16.60% | 16.39% |
| Margins: EBIT | 18.63% | 18.76% | 18.73% |
| Margins: EBITDA | 24.66% | 24.20% | 26.92% |
| Margins: Gross | 62.17% | 66.93% | 87.29% |
| Research & Development to Revenue | 0% | 0% | 0% |
While the company maintains commendable profitability margins, efficiency improvements could be harnessed for maximizing discretionary cash flows, thereby augmenting reinvestment capacity and consequent shareholder returns.
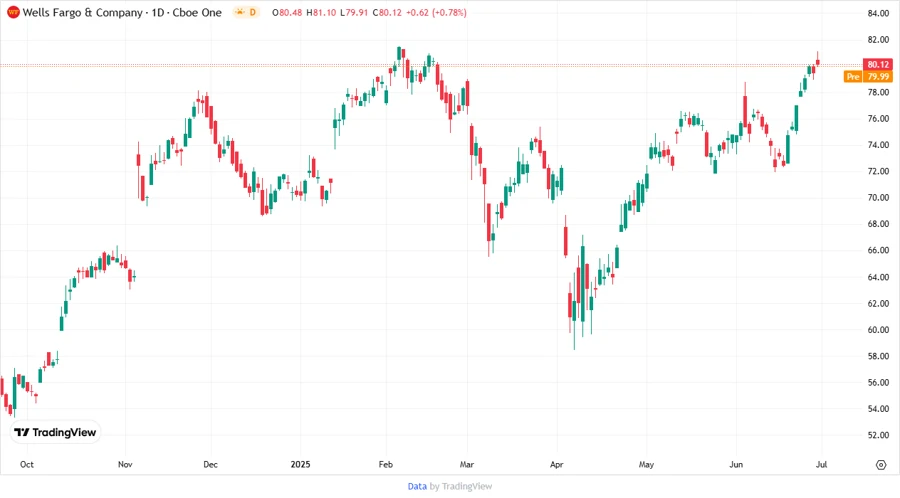
📈 Price Development
✅ Dividend Scoring System
Through our custom Dividend Scoring System, we evaluate Wells Fargo's critical areas, incorporating yield, stability, and overall financial health, ensuring a holistic review.
| Category | Score | Rating |
|---|---|---|
| Dividend yield | 3 | |
| Dividend Stability | 5 | |
| Dividend growth | 2 | |
| Payout ratio | 3 | |
| Financial stability | 3 | |
| Dividend continuity | 5 | |
| Cashflow Coverage | 2 | |
| Balance Sheet Quality | 3 |
Total Score: 26/40
📈 Rating
Wells Fargo & Company demonstrates a stable dividend history with commendable payout consistency and a solid financial structure. Nevertheless, vigilance in monitoring cash flow allocations and leveraging strategies is necessary. The investment is recommended for those valuing consistent income, recognizing the trade-off of lower growth spurts in dividend increments.
Smart Data Insight
Master the Perfect Entry & Exit for this Stock
Don't leave your profits to chance. Historically, this stock follows specific seasonal patterns that institutional traders use to maximize returns.
- ✅ Identify the "Golden Buying Window"
- ✅ Avoid high-risk correction cycles
- ✅ Backtested data from the last 20+ years