
July 07, 2026 a 02:03 pm
WELL: Trend and Support & Resistance Analysis - Welltower Inc.
Welltower Inc. (NYSE: WELL) has shown an intriguing price movement over the observed period. As a leader in reshaping healthcare infrastructure, Welltower Inc. consistently partners with top operators in the industry. The recent data points towards a positive adjustment in the stock's direction. The company continues to strategically expand its portfolio in rapidly growing markets, reflecting stability and potential growth in the healthcare real estate sector.
Trend Analysis
| Date | Close Price | Trend |
|---|---|---|
| 07/07/2026 | 236.34 | ▲ |
| 07/06/2026 | 232.69 | ▼ |
| 07/02/2026 | 236.06 | ▲ |
| 07/01/2026 | 230.19 | ▼ |
| 06/30/2026 | 226.97 | ▼ |
| 06/29/2026 | 227.73 | ▲ |
| 06/26/2026 | 227.33 | ▼ |
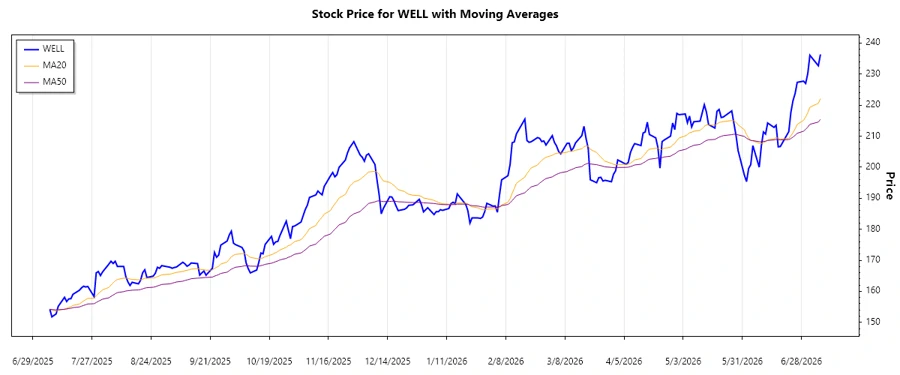
The recent upward adjustment in EMA20 relative to EMA50 suggests a bullish sentiment. However, the short-term fluctuations require close monitoring to confirm a sustained upward trend.
Support and Resistance
| Support Zone | Resistance Zone |
|---|---|
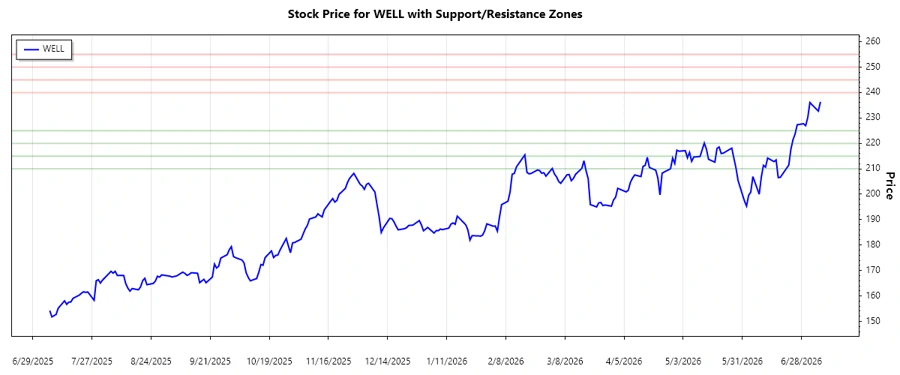
| 220.00 - 225.00 | 240.00 - 245.00 |
| 210.00 - 215.00 | 250.00 - 255.00 |
The current price positioning within the previously identified support zone highlights stability. A breakthrough in the resistance zone would confirm bullish continuity.
Conclusion
Welltower Inc. is currently experiencing a positive trajectory, reaffirming its strategies in the rapidly evolving healthcare sector. While the recent EMA indicators point towards an upward trend, investors should remain vigilant to ensure sustained progress against market volatility. The presence within the support zone consolidates its resilience, yet testing the resistance could fortify the upward momentum. The company's strategic plans in expanding its portfolio remain lucrative, positioning Welltower Inc. as a potential growth stock amidst the backdrop of the healthcare industry’s evolution.
Smart Data Insight
Master the Perfect Entry & Exit for this Stock
Don't leave your profits to chance. Historically, this stock follows specific seasonal patterns that institutional traders use to maximize returns.
- ✅ Identify the "Golden Buying Window"
- ✅ Avoid high-risk correction cycles
- ✅ Backtested data from the last 20+ years