February 04, 2026 a 05:15 am
WELL: Fibonacci Analysis - Welltower Inc.
Welltower Inc. has demonstrated strong growth potential with its strategic focus on transforming healthcare infrastructure. The recent trend in WELL's stock was predominantly upward, reflecting investor confidence and positive market sentiment. As a leading REIT, Welltower capitalizes on its investments in senior housing and healthcare facilities, catering to high-growth markets across the U.S., Canada, and the U.K.
Fibonacci Analysis
| Parameter | Value |
|---|---|
| Start Date | 2025-08-11 |
| End Date | 2025-12-08 |
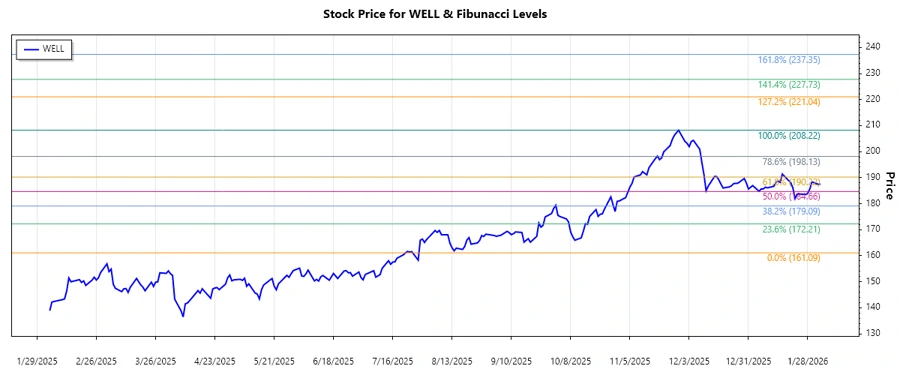
| High Point (Price & Date) | $208.22 on 2025-11-28 |
| Low Point (Price & Date) | $161.09 on 2025-07-21 |
| Fibonacci Level | Price Level |
|---|---|
| 0.236 | $176.88 |
| 0.382 | $180.15 |
| 0.5 | $184.56 |
| 0.618 | $188.97 |
| 0.786 | $194.57 |
The current stock price is within the 0.618 Fibonacci retracement level, indicating a possible support area. This level suggests a consolidation phase, which could precede a potential continuation of the upward trend if confirmed by additional market indicators.
Conclusion
The upward trend in Welltower Inc.'s stock reflects strong market confidence, driven by strategic advancements in healthcare infrastructure. The stock's position within a Fibonacci retracement zone indicates potential support, warranting close monitoring. However, investors should be cautious of market volatility and sector-specific risks in the REIT industry. The Fibonacci levels serve as crucial indicators for identifying potential support and resistance zones.