August 12, 2025 a 10:15 am
WELL: Fibonacci Analysis - Welltower Inc.
Welltower Inc. has shown a consistent upward trend in the recent months, reflecting the company’s strong position within the healthcare infrastructure market. Its investments in senior housing and medical properties across key markets have contributed to its growth. Investors might find reassurance in Welltower's solid foundation and strategic growth plans, despite potential market volatilities.
Fibonacci Analysis
| Metrics | Details |
|---|---|
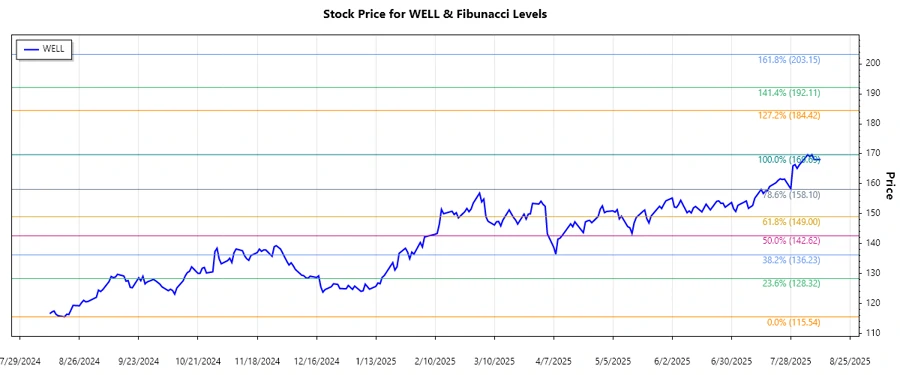
| Trend Start Date | 2024-08-19 |
| Trend End Date | 2025-08-11 |
| High Price (Date) | $169.69 (2025-08-05) |
| Low Price (Date) | $115.54 (2024-08-19) |
| Fibonacci Level | Price Level |
|---|---|
| 0.236 | $135.40 |
| 0.382 | $143.32 |
| 0.5 | $147.62 |
| 0.618 | $151.91 |
| 0.786 | $158.73 |
The current price of $168.03 is above the 0.786 Fibonacci level, indicating the potential establishment of new support levels. This could imply a resistant phase, where the stock might consolidate before potentially advancing further.
Conclusion
Welltower Inc.’s stock has demonstrated a strong upward trend, benefiting from strategic investments in the healthcare sector. The analysis suggests a supportive environment for continued growth, though market fluctuations and external factors could introduce risks. Current price movements have surpassed expected retracement levels, indicating robust investor confidence. However, vigilance is advised as market dynamics can change. Technical analysts may view Welltower as a strong candidate for growth, provided that market conditions remain favorable, and its business strategies continue to align with emerging healthcare demands.
Smart Data Insight
Master the Perfect Entry & Exit for this Stock
Don't leave your profits to chance. Historically, this stock follows specific seasonal patterns that institutional traders use to maximize returns.
- ✅ Identify the "Golden Buying Window"
- ✅ Avoid high-risk correction cycles
- ✅ Backtested data from the last 20+ years