
July 15, 2026 a 02:46 am

WELL: Dividend Analysis - Welltower Inc.
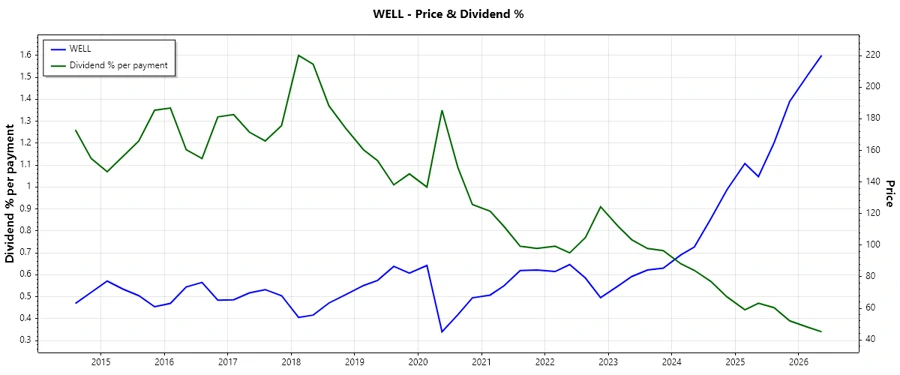
Welltower Inc. presents a stable dividend profile with a history of consistent payments, boasting 42 years of dividend disbursements. While the current yield is modest, the company's commitment to shareholder returns is evident through its regular disbursements. However, investors should be cautious of its high payout ratios which might impact future flexibility. Overall, Welltower remains a respectable choice for income-focused portfolios, especially within the healthcare real estate sector.
📊 Overview
Welltower Inc. operates within the healthcare real estate sector, offering a dividend yield of 1.34%. With a current dividend per share of $2.82, the company has a historical dividend distribution spanning 42 years.
| Metric | Value |
|---|---|
| Sector | Healthcare Real Estate |
| Dividend Yield | 1.34% |
| Current Dividend per Share | $2.82 |
| Dividend History | 42 years |
| Last Cut or Suspension | None |
📈 Dividend History
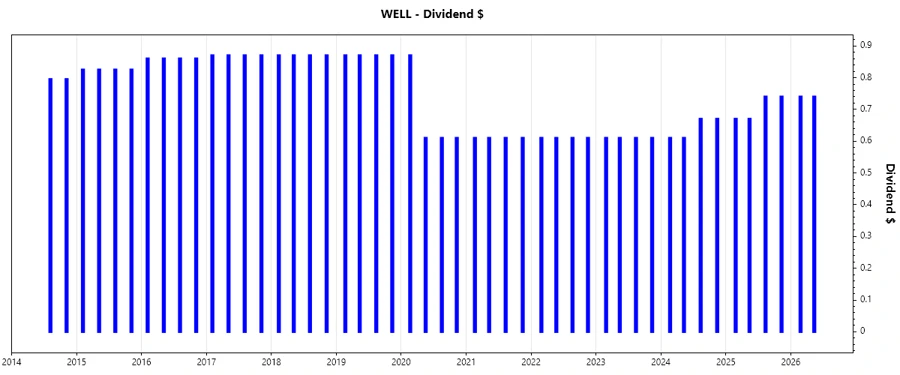
The historical performance of dividends is crucial as it highlights Welltower’s reliability in rewarding shareholders. It’s a testament to their commitment even through financial challenges.
| Year | Dividend per Share |
|---|---|
| 2026 | $1.48 |
| 2025 | $2.82 |
| 2024 | $2.56 |
| 2023 | $2.44 |
| 2022 | $2.44 |
🔍 Dividend Growth
Investors consider dividend growth as a critical factor for long-term investment, marking potential increases in revenue and profitability. Welltower’s growth over the past five years indicates moderate but reliable increases.
| Time | Growth |
|---|---|
| 3 years | 4.94% |
| 5 years | 0.87% |
The average dividend growth is 0.87% over 5 years. This shows moderate but steady dividend growth.
⚠️ Payout Ratio
Understanding the payout ratio is key as it reflects the company's potential to sustain dividend payments. High ratios can hint at financial strain or limited growth prospects.
| Key Figure | Ratio |
|---|---|
| EPS-based | 140.27% |
| Free cash flow-based | 78.34% |
A 140.27% EPS payout ratio suggests dividends may not be sustainable through earnings alone, while a 78.34% FCF payout ratio reflects a better but still elevated level.
💧 Cashflow & Capital Efficiency
Evaluating a company’s cash flow and capital efficiency is pivotal for determining its capability to maintain and grow dividends, reinvest, and expand its operations.
| Year | 2025 | 2024 | 2023 |
|---|---|---|---|
| Free Cash Flow Yield | 2.31% | 2.89% | 3.34% |
| Earnings Yield | 0.76% | 1.25% | 0.73% |
| CAPEX to Operating Cash Flow | 1.17% | 2.58% | 3.17% |
| Stock-based Compensation to Revenue | 14.59% | 0.97% | 0.57% |
| Free Cash Flow / Operating Cash Flow Ratio | 98.83% | 97.42% | 96.83% |
The cash flow figures present a positive outlook for dividend sustainability given the operating cash flow coverage ratio, though capital expenditures remain a consideration.
📉 Balance Sheet & Leverage Analysis
A strong balance sheet and leverage levels offer insights into financial health, assuring investors of a company's ability to meet obligations and sustain operations.
| Year | 2025 | 2024 | 2023 |
|---|---|---|---|
| Debt-to-Equity | 0.51 | 0.52 | 0.63 |
| Debt-to-Assets | 0.32 | 0.33 | 0.37 |
| Debt-to-Capital | 0.34 | 0.34 | 0.39 |
| Net Debt to EBITDA | 7.08 | 4.77 | 5.88 |
| Current Ratio | 5.34 | 5.28 | 4.51 |
| Quick Ratio | 5.34 | 5.28 | 4.51 |
| Financial Leverage | 1.60 | 1.60 | 1.73 |
Despite moderate leverage ratios, Welltower's balance sheet shows a capacity to handle debt, supported by adequate liquidity metrics.
✅ Fundamental Strength & Profitability
Strong fundamental and profitability metrics indicate the company’s efficiency in using its resources and generating profits, which is crucial for sustaining dividend growth.
| Year | 2025 | 2024 | 2023 |
|---|---|---|---|
| Return on Equity | 2.22% | 2.98% | 1.34% |
| Return on Assets | 1.39% | 1.86% | 0.77% |
| Margins: Net | 8.78% | 12.12% | 5.25% |
| Margins: EBIT | 1.61% | 13.99% | 14.79% |
| Margins: EBITDA | 21.66% | 35.38% | 37.06% |
| Margins: Gross | 39.18% | 38.50% | 39.06% |
| R&D to Revenue | 0% | 0% | 0% |
Welltower showcases a stable profitability profile with efficient management returns, though their low R&D investment may hinder innovation.
📊 Price Development
🗣️ Dividend Scoring System
| Criteria | Score | Representation |
|---|---|---|
| Dividend Yield | 2 | |
| Dividend Stability | 4 | |
| Dividend Growth | 3 | |
| Payout Ratio | 2 | |
| Financial Stability | 4 | |
| Dividend Continuity | 5 | |
| Cashflow Coverage | 3 | |
| Balance Sheet Quality | 4 |
Total Score: 27/40
💼 Rating
Welltower Inc. maintains its status as a robust investment in the healthcare real estate industry. However, potential investors should consider the high payout rates and modest growth. Recommended for conservative portfolios prioritizing income.
Smart Data Insight
Master the Perfect Entry & Exit for this Stock
Don't leave your profits to chance. Historically, this stock follows specific seasonal patterns that institutional traders use to maximize returns.
- ✅ Identify the "Golden Buying Window"
- ✅ Avoid high-risk correction cycles
- ✅ Backtested data from the last 20+ years