January 05, 2026 a 07:31 am

WELL: Dividend Analysis - Welltower Inc.
Welltower Inc. is a beacon of dividend sustainability with over four decades of uninterrupted payments. Despite economic challenges, the company's commitment to shareholder returns remains strong, evidenced by its consistent dividend history and moderate growth. However, careful attention should be paid to the high EPS payout ratio, which could imply potential pressure on future payouts if earnings don't improve.
📊 Overview
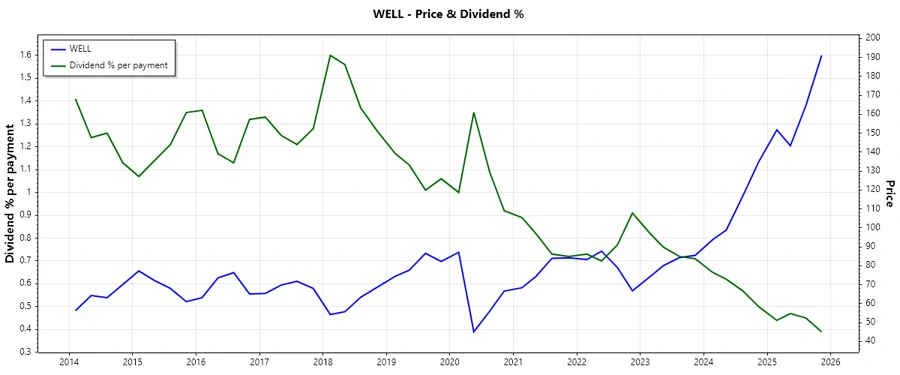
Welltower Inc. stands as a prominent figure in the healthcare real estate investment trust (REIT) sector. Key dividend metrics signify a robust history of dividend payments spanning 41 years. The current dividend yield is modest at 1.48%, with the last cut or suspension occurring in 2021, highlighting a largely stable dividend outlook.
| Metric | Details |
|---|---|
| Sector | Real Estate |
| Dividend yield | 1.48% |
| Current dividend per share | 2.56 USD |
| Dividend history | 41 years |
| Last cut or suspension | 2021 |
🗣️ Dividend History
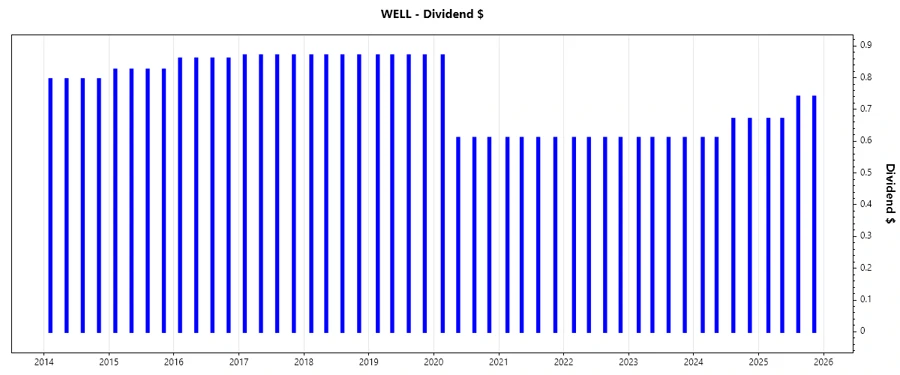
The heritage of continuous dividend payments distinguishes Welltower Inc., ensuring investor confidence through consistent returns. Historical stability often translates to perceived security in future income streams.
| Year | Dividend per Share (USD) |
|---|---|
| 2025 | 2.82 |
| 2024 | 2.56 |
| 2023 | 2.44 |
| 2022 | 2.44 |
| 2021 | 2.44 |
📈 Dividend Growth
The dividend growth for Welltower Inc. reflects a modest trajectory, symbolizing gradual increases. This growth trend is indicative of a cautious yet positive outlook for sustaining and potentially expanding dividend payments in the future.
| Time | Growth |
|---|---|
| 3 years | 4.94% |
| 5 years | 0.87% |
The average dividend growth is 0.87% over 5 years. This shows moderate but steady dividend growth.
📉 Payout Ratio
Analyzing the payout ratios reveals critical insights into Welltower Inc.'s dividend sustainability. The high EPS-based payout ratio demands vigilance, as it suggests the company is distributing significantly more than its earnings, which could prognosticate future distribution cuts if not supplemented by improved earnings.
| Key Figure | Ratio |
|---|---|
| EPS-based | 179.88% |
| Free cash flow-based | 63.44% |
The EPS payout ratio of 179.88% seems unsustainable without improvements in earnings. However, a 63.44% FCF payout ratio indicates a healthier scenario in terms of real cash position.
📊 Cashflow & Capital Efficiency
Cashflow assessment underscores Welltower Inc.'s cash generation capacity and efficiency, essential for maintaining long-term dividend commitments. Key measures address capital efficiency and overall financial health, considering the return on invested capital's reflection of efficient fund utilization.
| Metric | 2022 | 2023 | 2024 |
|---|---|---|---|
| Free Cash Flow Yield | 4.29% | 3.34% | 2.89% |
| Earnings Yield | 0.47% | 0.73% | 1.25% |
| CAPEX to Operating Cash Flow | 2.29% | 3.17% | 2.57% |
| Stock-based Compensation to Revenue | 0.45% | 0.57% | 0.965% |
| Free Cash Flow / Operating Cash Flow Ratio | 97.70% | 96.83% | 97.42% |
The cash flow efficiency metrics reflect a robust cash generation capacity that, if sustained, fortifies Welltower Inc.'s dividend projections against economic uncertainties.
💰 Balance Sheet & Leverage Analysis
Examining financial leverage and liquidity ratios offers insights into Welltower's risk management strategy and its financial health. These indicators are vital in appraising the ability to meet dividend payments amidst debt obligations.
| Metric | 2022 | 2023 | 2024 |
|---|---|---|---|
| Debt-to-Equity | 0.74 | 0.63 | 0.52 |
| Debt-to-Assets | 0.39 | 0.37 | 0.33 |
| Debt-to-Capital | 0.42 | 0.39 | 0.34 |
| Net Debt to EBITDA | 7.03 | 5.88 | 4.77 |
| Current Ratio | 2.63 | 4.51 | 5.40 |
| Quick Ratio | 2.63 | 4.51 | 5.28 |
| Financial Leverage | 1.87 | 1.73 | 1.60 |
Welltower's declining debt ratios suggest an improving balance sheet quality, with adequate liquidity to navigate financial obligations effectively.
📊 Fundamental Strength & Profitability
Profitability ratios, including return on equity and asset-based returns, provide a measure of Welltower's operational efficiency and capacity to generate value for shareholders. These metrics underscore the company's enduring financial resilience and profitability potential.
| Metric | 2022 | 2023 | 2024 |
|---|---|---|---|
| Return on Equity | 0.70% | 1.34% | 2.98% |
| Return on Assets | 0.37% | 0.77% | 1.86% |
| Margins: Net | 2.44% | 5.25% | 12.12% |
| Margins: EBIT | 12.16% | 14.79% | 13.99% |
| Margins: EBITDA | 35.31% | 37.06% | 35.48% |
| Margins: Gross | 38.38% | 39.06% | 38.50% |
| Research & Development to Revenue | 0% | 0% | 0% |
Despite modest returns on equity and assets, Welltower is maintaining profitability with healthy margins, underscoring efficient operational management.
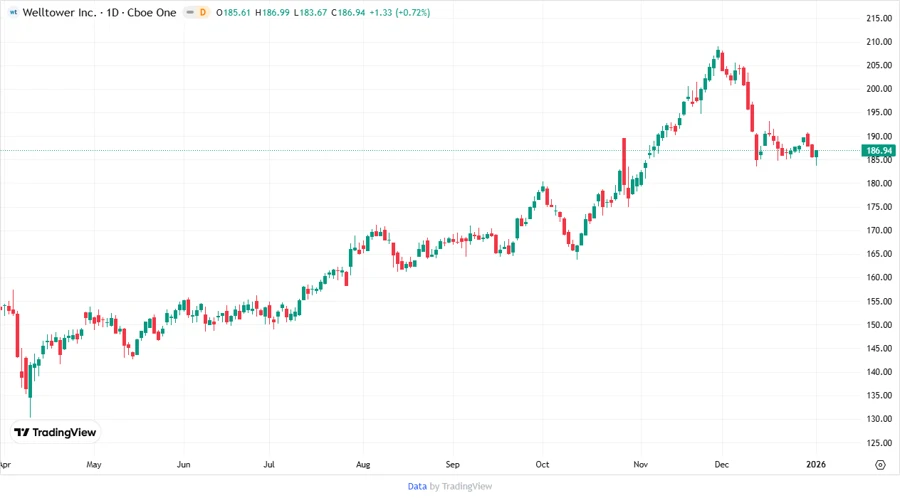
📈 Price Development
✅ Dividend Scoring System
| Criteria | Score | Visual |
|---|---|---|
| Dividend yield | 2 | |
| Dividend Stability | 4 | |
| Dividend growth | 3 | |
| Payout ratio | 3 | |
| Financial stability | 4 | |
| Dividend continuity | 5 | |
| Cashflow Coverage | 4 | |
| Balance Sheet Quality | 4 |
Total Score: 29/40
🗣️ Rating
Welltower Inc. demonstrates a solid track record of dividend sustainability, supported by stable cashflow and a robust balance sheet. While the current yield and payout ratios demand caution, the company remains a reliable dividend payer with a commendable history and positive growth potential. Investors may find Welltower a worthwhile addition for steady income-focused portfolios.