November 10, 2025 a 03:31 am

WELL: Dividend Analysis - Welltower Inc.
Welltower Inc. presents a fascinating dividend profile guided by stable historical payouts. With a modest dividend yield contrasting a long-standing payment history, the company delivers a mixed bag in the realms of dividend growth and payout sustainability. Investors may find particular interest in its conservative payout ratios aligned with significant balance sheet stability, making it a distinctive option within the healthcare REIT sector.
📊 Overview
Welltower Inc. positions itself robustly within the healthcare real estate sector, characterized by a modest dividend yield and a reputable dividend history spanning over four decades.
| Metric | Details |
|---|---|
| Sector | Healthcare Real Estate |
| Dividend Yield | 1.48% |
| Current Dividend per Share | 2.56 USD |
| Dividend History | 41 years |
| Last Cut or Suspension | 2021 |
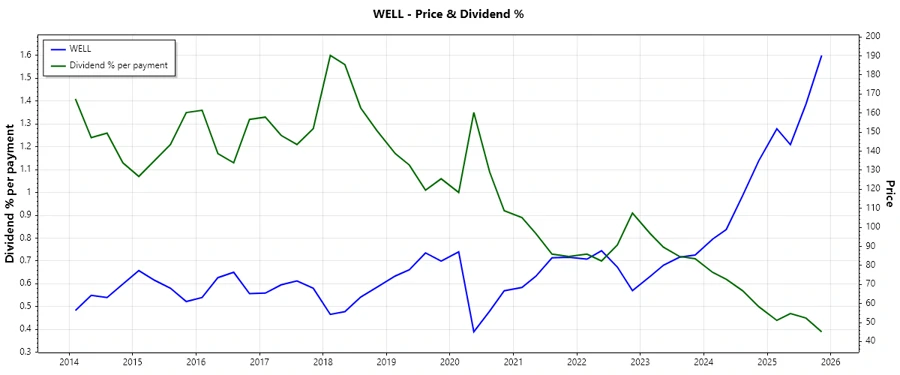
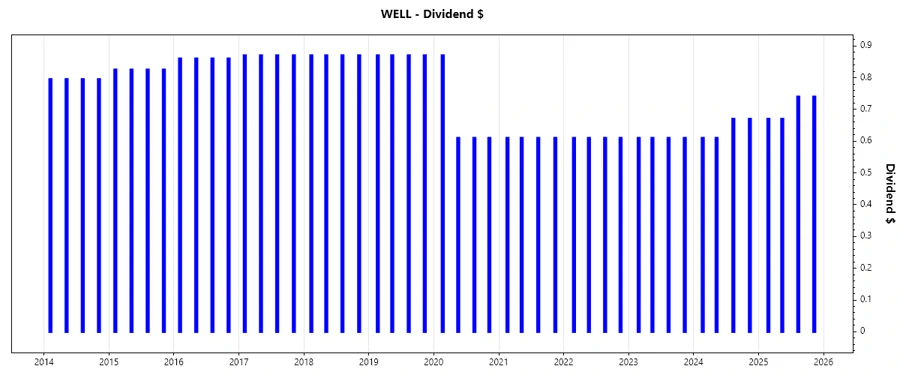
📈 Dividend History
The dividend history of Welltower Inc. is a testament to its longstanding commitment to return value to shareholders. The consistency of payments gifts a sense of reliability, crucial for income-focused investors.
| Year | Dividend per Share (USD) |
|---|---|
| 2025 | 2.82 |
| 2024 | 2.56 |
| 2023 | 2.44 |
| 2022 | 2.44 |
| 2021 | 2.44 |
✅ Dividend Growth
The insights into dividend growth highlight a marginal but notable growth over 3 years with a decline over 5 years, reflecting the broader impacts of economic conditions on REITs.
| Time | Growth |
|---|---|
| 3 years | 1.61% |
| 5 years | -5.96% |
The average dividend growth is -5.96% over 5 years. This indicates a cautious dividend policy amidst changing market dynamics.
⚠️ Payout Ratio
Understanding the payout ratio helps assess the sustainability of dividends. Welltower Inc. reveals high ratios, signifying potential constraints under pressured earnings.
| Key figure ratio | Value |
|---|---|
| EPS-based | 179.88% |
| Free Cash Flow-based | 63.44% |
The exceptionally high EPS payout ratio suggests dividends may stretch the company's earnings, while the FCF ratio remains within a sustainable range.
💰 Cashflow & Capital Efficiency
Cash flow metrics provide a lens through which the financial health and operational strength of a company can be viewed. The yields and ratios herein offer a mix of returns and cash reinvestment insights.
| Year | 2024 | 2023 | 2022 |
|---|---|---|---|
| Free Cash Flow Yield | 2.89% | 3.34% | 4.28% |
| Earnings Yield | 1.25% | 0.73% | 0.47% |
| CAPEX to Operating Cash Flow | 2.58% | 3.17% | 2.29% |
| Stock-based Compensation to Revenue | 0.97% | 0.57% | 0.45% |
| Free Cash Flow / Operating Cash Flow Ratio | 97.42% | 96.83% | 97.71% |
Welltower Inc. demonstrates robust cash flow generation and efficient capital usage, underlined by steady Free Cash Flow relative to Operating Cash Flow percentages.
📉 Balance Sheet & Leverage Analysis
The examination of leverage and liquidity ratios showcases Welltower Inc.'s disciplined financial management, featuring moderate levels in debt metrics and comfortable liquidity conditions.
| Year | 2024 | 2023 | 2022 |
|---|---|---|---|
| Debt-to-Equity | 0.52 | 0.63 | 0.74 |
| Debt-to-Assets | 0.33 | 0.37 | 0.39 |
| Debt-to-Capital | 0.34 | 0.39 | 0.42 |
| Net Debt to EBITDA | 4.77 | 5.88 | 7.03 |
| Current Ratio | 5.28 | 4.51 | 2.63 |
| Quick Ratio | 5.28 | 4.51 | 2.63 |
| Financial Leverage | 1.60 | 1.73 | 1.87 |
Despite substantial debt levels, Welltower Inc.'s leverage ratios remain controlled, bolstered by high current ratios indicating strong liquidity.
🗣️ Fundamental Strength & Profitability
Fundamental strength emerges through insulated margins and returns, accounting for Welltower Inc.'s foundational stability and its relative attractiveness for profitability-seeking stakeholders.
| Year | 2024 | 2023 | 2022 |
|---|---|---|---|
| Return on Equity | 2.98% | 1.34% | 0.70% |
| Return on Assets | 1.86% | 0.77% | 0.37% |
| Margins: Net | 12.12% | 5.25% | 2.44% |
| Margins: EBIT | 13.99% | 14.79% | 12.16% |
| Margins: EBITDA | 35.38% | 37.06% | 35.31% |
| Margins: Gross | 38.50% | 39.06% | 38.39% |
| R&D to Revenue | 0.00% | 0.00% | 0.00% |
The strengths reiterated in profitability and margin metrics suggest Welltower Inc. holds a reasonably profitable and efficient operational framework.
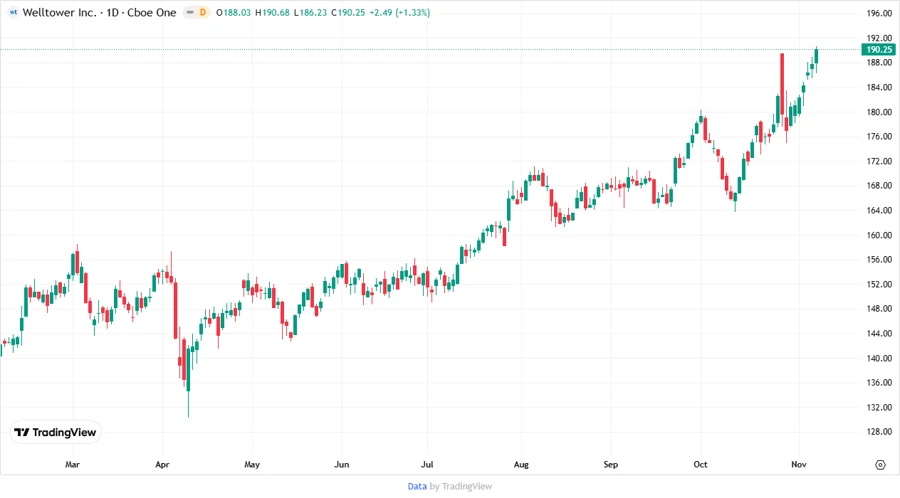
Price Development
🔍 Dividend Scoring System
| Category | Score | Bar |
|---|---|---|
| Dividend Yield | 3 | |
| Dividend Stability | 4 | |
| Dividend Growth | 2 | |
| Payout Ratio | 2 | |
| Financial Stability | 4 | |
| Dividend Continuity | 5 | |
| Cashflow Coverage | 4 | |
| Balance Sheet Quality | 4 |
Overall Score: 28 out of 40
Rating
📊 Welltower Inc. reflects a strategic equity within the REIT dividend sphere, offering consistent dividends buttressed by prudent financial management. The score indicates a strong performance, although some caution is advised due to observed high payout ratios. Investors prioritizing dividend stability and sustainability may find this company a favorable choice, except those seeking aggressive yield growth.
Smart Data Insight
Master the Perfect Entry & Exit for this Stock
Don't leave your profits to chance. Historically, this stock follows specific seasonal patterns that institutional traders use to maximize returns.
- ✅ Identify the "Golden Buying Window"
- ✅ Avoid high-risk correction cycles
- ✅ Backtested data from the last 20+ years