October 13, 2025 a 07:31 am


WELL: Dividend Analysis - Welltower Inc.
Welltower Inc. presents a stable, yet challenging, dividend profile. Despite a moderate dividend yield at approximately 1.67% and a lengthy history of 41 years of payments, recent trends toward dividend reduction highlight concerns. The EPS payout ratio exceeds 148%, pointing to potential unsustainability.
📊 Overview
Welltower Inc. operates within a resilient sector with a significant focus on real estate for a rapidly aging population. The dividend yield of 1.67% is moderate, providing a steady income stream. However, the last dividend cut or suspension is concerning regarding long-term dividend stability.
| Metric | Value |
|---|---|
| Sector | Real Estate |
| Dividend Yield | 1.67% |
| Current Dividend Per Share | $2.56 |
| Dividend History | 41 years |
| Last Cut or Suspension | None |
🗣️ Dividend History
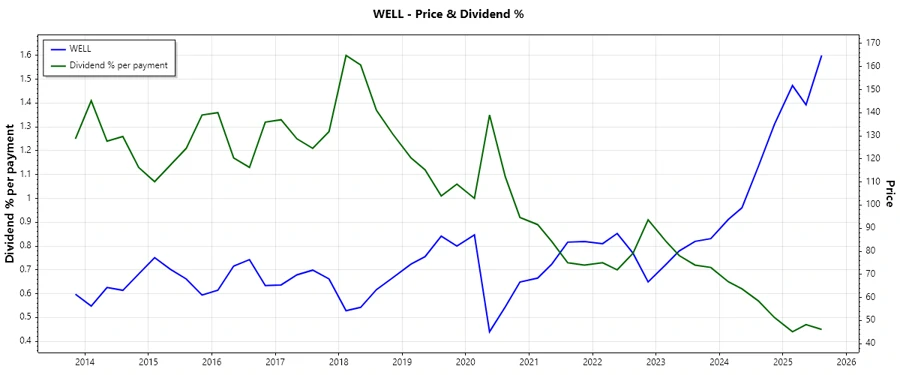
Welltower's dividend history displays resilience with over four decades of continuous payouts, an admirable track record in the real estate sector. Such consistency marks the company as a reliable income source, but recent reductions cast doubt on future stability.
This image represents WELL's dividend history for visual analysis.
| Year | Dividend Per Share (USD) |
|---|---|
| 2025 | 2.08 |
| 2024 | 2.56 |
| 2023 | 2.44 |
| 2022 | 2.44 |
| 2021 | 2.44 |
📈 Dividend Growth
The company's dividend growth has shown a minor positive trend over the last three years but has declined by approximately 5.96% over five years. These figures suggest a need for cautious optimism, as while short-term growth is stable, long-term sustainability is questionable.
| Time | Growth |
|---|---|
| 3 years | 1.61% |
| 5 years | -5.96% |
The average dividend growth is -5.96% over 5 years. This shows moderate but steady dividend growth in the short term, but a negative trend in the long run raises concerns.
This image captures WELL's dividend growth trends for the past years.
⚠️ Payout Ratio
The payout ratios highlight significant pressures on Welltower's dividend policy. An EPS-based payout ratio exceeding 148% indicates stretched profitability in covering dividends from earnings. Meanwhile, a FCF-based payout at over 66% suggests reliance on cash flow for dividend sustainability.
| Key Figure | Ratio |
|---|---|
| EPS-based | 148.95% |
| Free cash flow-based | 66.35% |
The significantly high EPS payout ratio is alarming, indicating that the dividend payments may not be sustainable solely from earnings.
✅ Cashflow & Capital Efficiency
Reviewing Welltower's cashflow reveals vital aspects of financial health and operation efficiency, crucial for sustaining dividends. The FCF yield and the near-optimal FCF/Operating Cash Flow ratio suggest adequate liquidity. However, the potential over-leverage could impact capital reinvestment capabilities.
| Metric/Year | 2022 | 2023 | 2024 |
|---|---|---|---|
| Free Cash Flow Yield | 4.29% | 3.34% | 2.89% |
| Earnings Yield | 0.47% | 0.73% | 1.25% |
| CAPEX to Operating Cash Flow | 2.29% | 3.17% | 2.58% |
| Stock-based Compensation to Revenue | 0.45% | 0.57% | 0.97% |
| Free Cash Flow / Operating Cash Flow Ratio | 97.71% | 96.83% | 97.42% |
The stable cash flow indicators and capital efficiency metrics portray a decent foundation, crucial for navigating financial obligations and maintaining dividend payouts.
📉 Balance Sheet & Leverage Analysis
The leverage shows mixed results, with a manageable debt-to-equity ratio yet increasing net debt to EBITDA. The financial leverage underlines growing obligations, necessitating focused management to balance risk and liquidity.
| Metric/Year | 2022 | 2023 | 2024 |
|---|---|---|---|
| Debt-to-Equity | 73.73% | 63.45% | 52.44% |
| Debt-to-Assets | 39.49% | 36.62% | 32.83% |
| Debt-to-Capital | 42.44% | 38.82% | 34.40% |
| Net Debt to EBITDA | 7.03 | 5.88 | 4.77 |
| Current Ratio | 2.63 | 4.51 | 5.28 |
| Quick Ratio | 2.63 | 4.51 | 5.28 |
| Financial Leverage | 1.87 | 1.73 | 1.60 |
Welltower's decreased financial leverage indicates improved capital handling, yet dependence on substantial debt facilities remains a risk factor.
🔍 Fundamental Strength & Profitability
The fundamentals underline limited profitability with margins showing a constrained operational upside. Despite marginal improvements, returns on capital are modest, bordered by tight expense control and operational efficiency.
| Metric/Year | 2022 | 2023 | 2024 |
|---|---|---|---|
| Return on Equity | 0.70% | 1.34% | 2.98% |
| Return on Assets | 0.37% | 0.77% | 1.86% |
| Net Margin | 2.44% | 5.25% | 12.12% |
| EBIT Margin | 12.16% | 14.79% | 13.99% |
| EBITDA Margin | 35.31% | 37.06% | 35.38% |
| Gross Margin | 38.39% | 39.06% | 38.50% |
Marginal profitability is observed, hinting at pressure to enhance capital returns and control costs for heightened financial resilience and sustainable dividends.
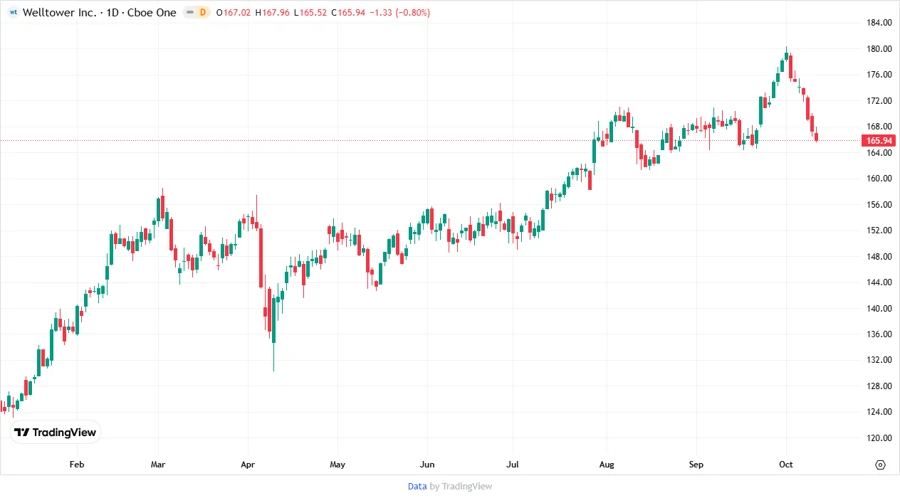
📈 Price Development
A comprehensive image depicting WELL's stock price development.
📝 Dividend Scoring System
| Category | Score | Remarks |
|---|---|---|
| Dividend Yield | 3 | |
| Dividend Stability | 4 | |
| Dividend Growth | 2 | |
| Payout Ratio | 2 | |
| Financial Stability | 3 | |
| Dividend Continuity | 5 | |
| Cashflow Coverage | 4 | |
| Balance Sheet Quality | 3 |
Overall Score: 26/40
⭐ Rating
Welltower Inc. exhibits a strong basis for dividend continuity but faces pressures of maintaining growth and payout sustainability under tightened financial conditions. A cautious "Hold" is recommended for conservative investors prioritizing stability over aggressive yield growth.
Smart Data Insight
Master the Perfect Entry & Exit for this Stock
Don't leave your profits to chance. Historically, this stock follows specific seasonal patterns that institutional traders use to maximize returns.
- ✅ Identify the "Golden Buying Window"
- ✅ Avoid high-risk correction cycles
- ✅ Backtested data from the last 20+ years