September 08, 2025 a 07:32 am


WELL: Dividend Analysis - Welltower Inc.
Welltower Inc. presents itself as a resilient player in the healthcare real estate investment trust sector, with a substantial market capitalization of over $112 billion. Though the current dividend yield stands at a modest 1.67%, the company's impressive 41-year history of dividend payments enhances its appeal. However, with a payout ratio significantly exceeding earnings, potential investors should be cautious of future dividend stability.
📊 Overview
Welltower Inc. operates primarily within the healthcare facilities sector, capitalizing on the essential nature of its services.
| Sector | Dividend Yield | Current Dividend Per Share (USD) | Dividend History | Last Cut or Suspension |
|---|---|---|---|---|
| Healthcare | 1.67% | 2.56 | 41 years | None |
📈 Dividend History
Welltower's consistent dividend history over four decades underscores its reliability to shareholders. This historic performance reinforces stakeholder confidence, despite recent reductions.
| Year | Dividend Per Share (USD) |
|---|---|
| 2025 | 2.08 |
| 2024 | 2.56 |
| 2023 | 2.44 |
| 2022 | 2.44 |
| 2021 | 2.44 |
📈 Dividend Growth
Dividend growth serves as an indicator of a company's earning stability and commitment to rewarding shareholders. Welltower's recent growth figures may indicate areas for cautious optimism moving forward.
| Time | Growth |
|---|---|
| 3 years | 1.61% |
| 5 years | -5.96% |
The average dividend growth is -5.96% over 5 years. This shows moderate but steady dividend growth amidst market fluctuations.
📊 Payout Ratio
Payout ratios provide insight into the sustainability of a company's dividend payments relative to its earnings and cash flows.
| Key Figure | Ratio |
|---|---|
| EPS-based | 148.95% |
| Free cash flow-based | 66.26% |
The 148.95% EPS payout ratio indicates a potential risk for dividend sustainability if earnings do not improve, although FCF coverage of 66.26% suggests near-term stability.
💵 Cashflow & Capital Efficiency
Analyzing cash flows and capital efficiency is crucial for assessing Welltower's ability to fund its operations and return capital to shareholders.
| Metric | 2024 | 2023 | 2022 |
|---|---|---|---|
| Free Cash Flow Yield | 2.89% | 3.34% | 4.29% |
| Earnings Yield | 1.25% | 0.73% | 0.46% |
| CAPEX to Operating Cash Flow | 2.58% | 3.17% | 2.29% |
| Stock-based Compensation to Revenue | 0.96% | 0.57% | 0.45% |
| Free Cash Flow / Operating Cash Flow Ratio | 97.42% | 96.83% | 97.71% |
Welltower's cash flows demonstrate operational efficiency, though fluctuating yields may pose challenges to consistent capital effectiveness.
📉 Balance Sheet & Leverage Analysis
Understanding the financial structure is vital for evaluating Welltower's ability to manage debt and fulfill financial obligations without compromising growth.
| Metric | 2024 | 2023 | 2022 |
|---|---|---|---|
| Debt-to-Equity | 0.52 | 0.63 | 0.73 |
| Debt-to-Assets | 0.33 | 0.37 | 0.39 |
| Net Debt to EBITDA | 4.77 | 5.88 | 7.03 |
| Current Ratio | 5.28 | 4.51 | 2.63 |
| Quick Ratio | 5.28 | 4.51 | 2.63 |
Welltower shows improvement in leverage metrics year-on-year, signaling progressive financial consolidation.
📈 Fundamental Strength & Profitability
Profitability metrics provide a comprehensive view of Welltower's operational success and its capability to generate shareholder value.
| Metric | 2024 | 2023 | 2022 |
|---|---|---|---|
| Return on Equity | 2.98% | 1.34% | 0.70% |
| Net Margin | 12.12% | 5.25% | 2.44% |
| EBIT Margin | 13.99% | 14.79% | 12.16% |
| Gross Margin | 38.50% | 39.06% | 38.39% |
| Research & Development to Revenue | 0% | 0% | 0% |
Despite consistent gross margins, analyzing net margins and ROE trends could indicate areas where profitability may be bolstered.
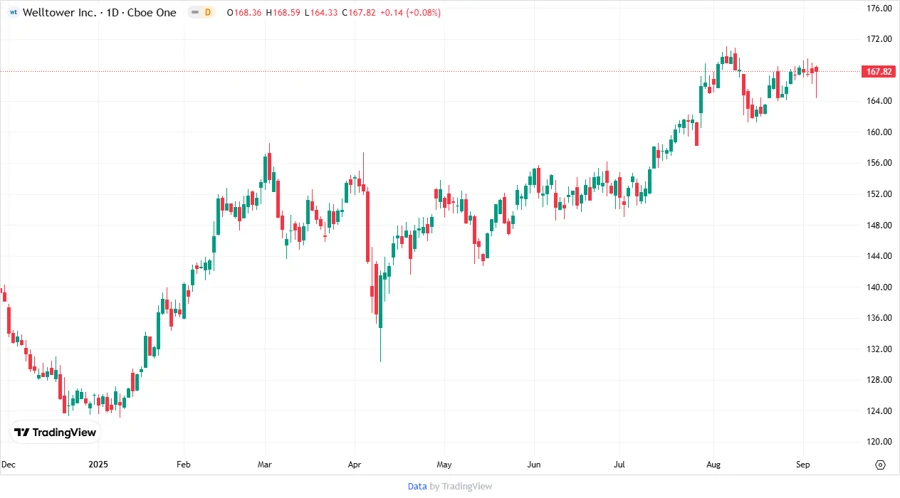
💰 Price Development
🔍 Dividend Scoring System
| Criteria | Score | Indicator |
|---|---|---|
| Dividend yield | 2 | |
| Dividend Stability | 4 | |
| Dividend growth | 3 | |
| Payout ratio | 2 | |
| Financial stability | 4 | |
| Dividend continuity | 5 | |
| Cashflow Coverage | 4 | |
| Balance Sheet Quality | 4 |
Total Score: 28/40
🌟 Rating
Overall, Welltower Inc. demonstrates a robust commitment to maintaining dividend payments and has shown financial resilience. Investors should consider the high payout ratio alongside promising financial stability improvements. The investment presents moderate growth potential with an emphasis on consistent return and shareholder value orientation.
Smart Data Insight
Master the Perfect Entry & Exit for this Stock
Don't leave your profits to chance. Historically, this stock follows specific seasonal patterns that institutional traders use to maximize returns.
- ✅ Identify the "Golden Buying Window"
- ✅ Avoid high-risk correction cycles
- ✅ Backtested data from the last 20+ years