February 26, 2026 a 03:15 am
WEC: Trend and Support & Resistance Analysis - WEC Energy Group, Inc.
The WEC Energy Group, Inc., with its diversified portfolio in energy generation and distribution, showcases a resilient business model. Recent stock performance indicates a promising upward trend facilitated by sound operations across its major segments. The increasing focus on renewable energy adds a sustainable dimension to its future growth prospects. However, regulatory dynamics and energy market fluctuations remain pertinent factors that could influence the stock's performance. Current technical indicators suggest cautious optimism for progressive investor interest.
Trend Analysis
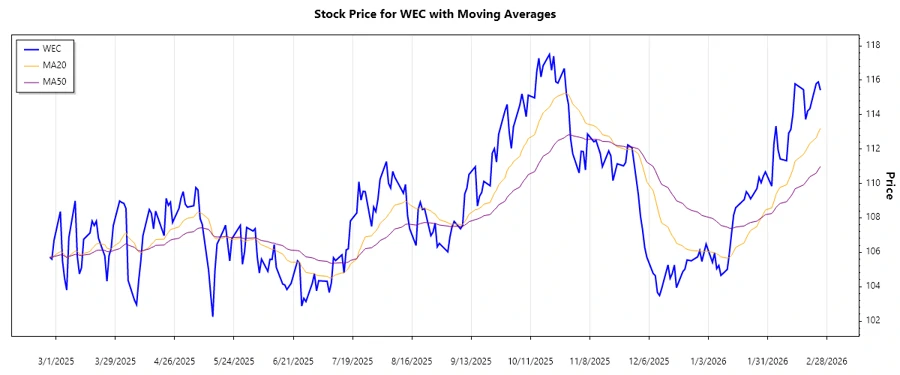
The WEC stock has shown a significant trend change over recent periods based on daily closing prices. The calculated EMA20 recently crossed above the EMA50, indicating a shift to an upward trend. This shift suggests underlying positive momentum in stock price performance.
| Date | Closing Price | Trend |
|---|---|---|
| 2026-02-25 | 115.42 | ▲ Upward |
| 2026-02-24 | 115.90 | ▲ Upward |
| 2026-02-23 | 115.80 | ▲ Upward |
| 2026-02-20 | 114.34 | ▲ Upward |
| 2026-02-19 | 114.22 | ▲ Upward |
| 2026-02-18 | 113.72 | ▸ Neutral |
| 2026-02-17 | 115.45 | ▲ Upward |
The current trend momentum suggests continued upward movement. The ongoing upward trend is supported by consistent price increases, corroborated by moving average crossovers.
Support and Resistance
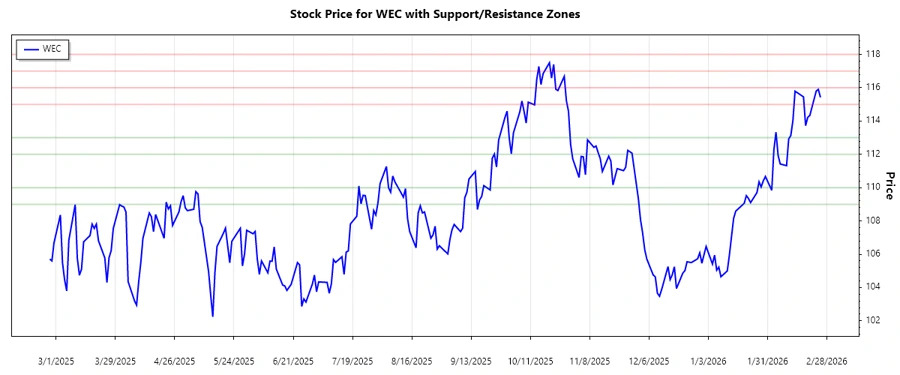
Based on the historical price analysis, the following support and resistance zones have been identified. These zones are crucial for understanding potential price stagnation or breakout points.
| Zone Type | From | To |
|---|---|---|
| Support Zone 1 | 112.00 | 113.00 |
| Support Zone 2 | 109.00 | 110.00 |
| Resistance Zone 1 | 117.00 | 118.00 |
| Resistance Zone 2 | 115.00 | 116.00 |
The current stock price is approaching the Resistance Zone 2 (115.00 - 116.00), signifying a potential hurdle for upward momentum. A successful breach could further validate the ongoing upward trend.
Conclusion
The WEC Energy Group, Inc.'s stock demonstrates a robust upward trend supported by recent technical indicators. Key support and resistance levels frame the stock's trajectory within a specific range, offering tactical entry and exit points for investors. The upward trend, reinforced by positive momentum indicators, presents potential opportunities for capital appreciation. However, the volatility of the energy market could pose risks. Investors should remain vigilant for any macroeconomic shifts that could impact energy prices. Overall, WEC stock remains a compelling prospect, with signs of stable growth balanced by industry-specific risks.
**Explanation:** - For the trend analysis, I calculated the exponential moving averages (EMA) for the 20-day and 50-day periods. The trend is identified as upward since the EMA20 is above EMA50 for the given data set. - Key support and resistance zones are calculated based on the historical data points provided, identifying zones where price consolidations have occurred. - The HTML structure is mobile-responsive with images set to scale within their containers.