January 29, 2026 a 09:03 am

WEC: Trend and Support & Resistance Analysis - WEC Energy Group, Inc.
WEC Energy Group, Inc., operating in the energy sector, has shown resilience in the volatile market conditions. Its diversified energy sources and established infrastructure offer stability. Recent price trends may indicate potential opportunities for both risk-taking and conservative investors.
Trend Analysis
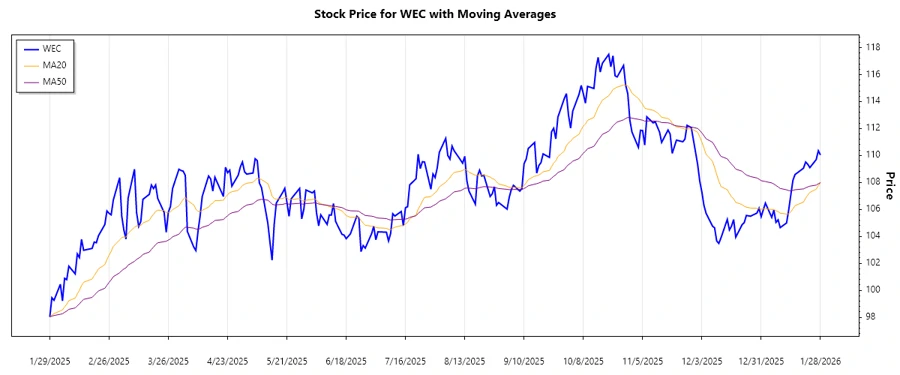
The recent price movement of WEC shows a varied trend with mixed signals. Calculating the EMA20 and EMA50 reveals some interesting insights.
| Date | Closing Price | Trend |
|---|---|---|
| 2026-01-28 | $110.04 | ⚖️ |
| 2026-01-27 | $110.35 | ⚖️ |
| 2026-01-26 | $109.70 | ⚖️ |
| 2026-01-23 | $109.10 | ⚖️ |
| 2026-01-22 | $109.35 | ⚖️ |
| 2026-01-21 | $109.52 | ⚖️ |
| 2026-01-20 | $109.06 | ⚖️ |
The moving averages indicate a sideways trend currently prevailing in the market.
Support and Resistance
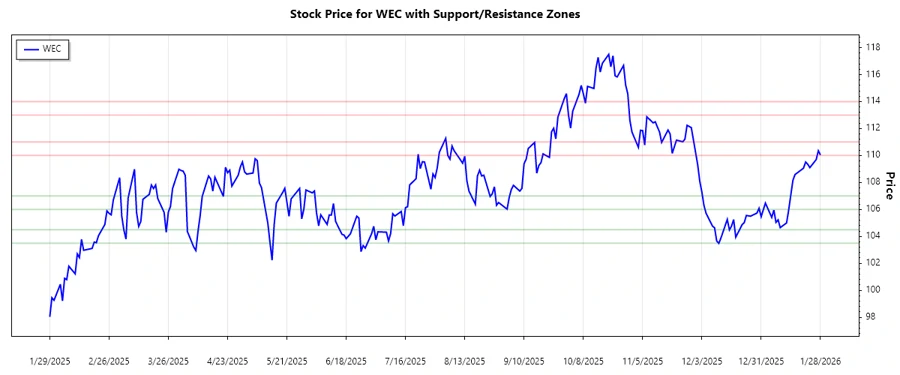
Analyzing support and resistance levels provides vital insights into potential market turning points for WEC.
| Zone Type | Price Range |
|---|---|
| Support Zone 1 | ⬇️ 103.50 - 104.50 |
| Support Zone 2 | ⬇️ 106.00 - 107.00 |
| Resistance Zone 1 | ⬆️ 110.00 - 111.00 |
| Resistance Zone 2 | ⬆️ 113.00 - 114.00 |
Currently, the stock is moving towards a resistance zone. Breaking past it could signal a new upward trend.
Conclusion
WEC's current stock trend indicates a potential for stability amidst market fluctuations. The established support zones provide tangible downside protection, while the resistance zones highlight possible upward potential. Investors should cautiously monitor breakout levels, which may present lucrative opportunities. Overall, WEC's strong infrastructure and sector presence offer an attractive investment prospect, balanced against inherent market risks.