September 01, 2025 a 03:32 pm


WEC: Dividend Analysis - WEC Energy Group, Inc.
WEC Energy Group exhibits a robust dividend profile with a consistent history of increasing payments. The company has maintained its dividend for over four decades, indicating strong shareholder value commitment. Despite a high payout against free cash flow, the stability in its payouts and its yield relative to sector norms make it a notable candidate for income-focused investors.
📊 Overview
The overview of WEC showcases its strong position within the energy sector, marked by a satisfactory dividend yield and a commendable history of dividend payments.
| Metric | Value |
|---|---|
| Sector | Energy |
| Dividend Yield | 3.25% |
| Current Dividend per Share | 3.34 USD |
| Dividend History | 40 years |
| Last Cut or Suspension | None |
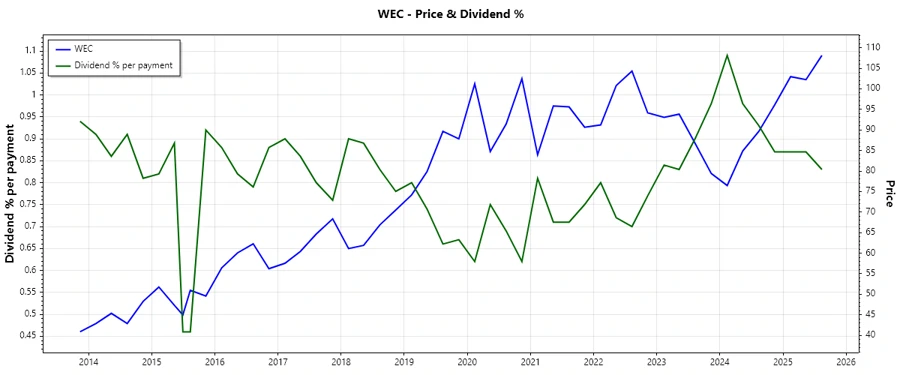
📉 Dividend History
WEC's consistent dividend history of over 40 years highlights its commitment to returning capital to shareholders. This history is vital for investors focusing on steady income.
| Year | Dividend per Share (USD) |
|---|---|
| 2025 | 2.68 |
| 2024 | 3.34 |
| 2023 | 3.12 |
| 2022 | 2.91 |
| 2021 | 2.71 |
📈 Dividend Growth
Examining WEC's dividend growth over the past few years indicates a steady increase, despite moderate growth percentages.
| Time | Growth |
|---|---|
| 3 years | 7.22% |
| 5 years | 7.19% |
The average dividend growth is 7.19% over 5 years. This shows moderate but steady dividend growth.
🗣️ Payout Ratio
Payout ratios are essential for assessing the sustainability of dividend payments. High ratios compared to earnings and cash flow may indicate potential constraints on future increases.
| Key Figure | Ratio |
|---|---|
| EPS-based | 64.08% |
| Free Cash Flow-based | 700.41% |
The EPS-based payout ratio is 64.08%, indicating a healthy level relative to earnings. However, the payout ratio based on free cash flow is particularly high at 700.41%, suggesting that not all cash flow supports dividend payouts sustainably.
Cashflow & Capital Efficiency
Cash flow and capital efficiency are key metrics to judge the ability to maintain dividend payments and support growth.
| Metric | 2024 | 2023 | 2022 |
|---|---|---|---|
| Free Cash Flow Yield | 1.45% | 1.98% | -0.92% |
| Earnings Yield | 5.14% | 5.02% | 4.77% |
| CAPEX to Operating Cash Flow | 86.59% | 82.59% | 113.27% |
| Stock-based Compensation to Revenue | 0% | 0% | 0.36% |
| Free Cash Flow / Operating Cash Flow Ratio | 13.41% | 17.41% | -13.27% |
WEC demonstrates moderate capital efficiency with fluctuating free cash flow yields. The dependency on operating cash flow and moderate earnings yield show areas for potential improvement in capital utilization efficiency.
Balance Sheet & Leverage Analysis
A balance sheet and leverage analysis provides insights into the overall financial stability and debt capacity of WEC.
| Metric | 2024 | 2023 | 2022 |
|---|---|---|---|
| Debt-to-Equity | 1.64 | 1.60 | 1.52 |
| Debt-to-Assets | 42.92% | 42.78% | 41.48% |
| Debt-to-Capital | 62.06% | 61.53% | 60.36% |
| Net Debt to EBITDA | 5.19 | 5.32 | 5.14 |
| Current Ratio | 0.60 | 0.55 | 0.69 |
| Quick Ratio | 0.43 | 0.40 | 0.52 |
| Financial Leverage | 3.81 | 3.74 | 3.67 |
The company's debt levels suggest a high degree of leverage and moderate financial pressure, highlighted by its quick ratio and high debt-to-equity metrics.
Fundamental Strength & Profitability
Fundamental and profitability metrics reveal intrinsic value and efficiency of WEC's operations in yielding profits.
| Metric | 2024 | 2023 | 2022 |
|---|---|---|---|
| Return on Equity | 12.30% | 11.34% | 12.35% |
| Return on Assets | 3.23% | 3.03% | 3.37% |
| Net Margin | 17.77% | 14.99% | 14.68% |
| EBIT Margin | 29.79% | 25.45% | 23.42% |
| EBITDA Margin | 45.54% | 39.66% | 35.12% |
| Gross Margin | 44.02% | 40.50% | 34.39% |
| Research & Development to Revenue | 0% | 0% | 0% |
WEC demonstrates solid profitability metrics, indicating strong operational efficiency. However, a lack of investment in R&D may limit future innovation.
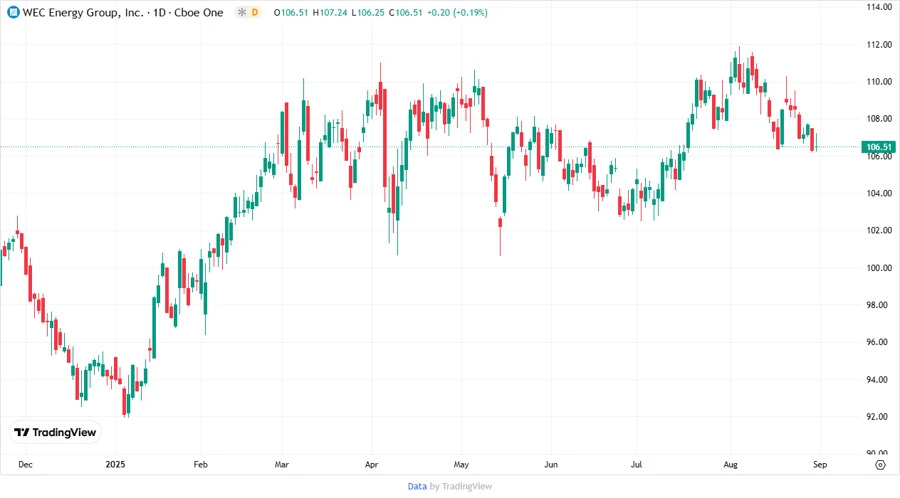
Price Development
✅ Dividend Scoring System
| Criterion | Score | Graph |
|---|---|---|
| Dividend Yield | 4 | |
| Dividend Stability | 5 | |
| Dividend Growth | 3 | |
| Payout Ratio | 2 | |
| Financial Stability | 3 | |
| Dividend Continuity | 5 | |
| Cashflow Coverage | 2 | |
| Balance Sheet Quality | 3 |
Total Score: 27 out of 40
Rating
Given the viable dividend yield, stable history, and moderate growth, coupled with high payout ratios and financial leverage—WEC Energy Group retains a solid but cautious rating. Investors may find appeal in its consistent payouts, while those focused on growth and cash flow coverage might need to account for the high payout ratio based on free cash flow.
Smart Data Insight
Master the Perfect Entry & Exit for this Stock
Don't leave your profits to chance. Historically, this stock follows specific seasonal patterns that institutional traders use to maximize returns.
- ✅ Identify the "Golden Buying Window"
- ✅ Avoid high-risk correction cycles
- ✅ Backtested data from the last 20+ years