February 14, 2026 a 05:15 am

WDC: Fibonacci Analysis - Western Digital Corporation
Western Digital Corporation, an influential player in the data storage sector, presents a compelling investment opportunity amidst its fluctuating market conditions. Recent data suggest a predominant bullish sentiment as the company continues to expand its product offerings internationally. This upward trend is underscored by significant market dynamics, positioning WDC as a potential candidate for growth within a competitive industry landscape. Our analysis seeks to provide clarity on strategic price levels via a comprehensive Fibonacci retracement assessment.
Fibonacci Analysis
| Trend Period | High (Date) | Low (Date) | Fibonacci Levels | Current Price | Interpretation |
|---|---|---|---|---|---|
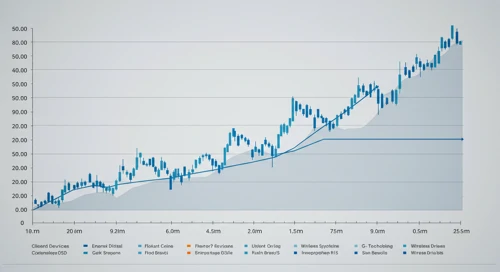
| From 2025-08-05 to 2026-02-09 | 285.99 (2026-02-09) | 74.64 (2025-08-05) |
|
281.58 | Currently above the 0.786 level, indicating potential resistance at higher levels. |
Conclusion
Western Digital Corporation's recent upward momentum suggests a robust buying interest, supportive of a prevailing bullish trend. The stock's current position above the 0.786 Fibonacci retracement level hints at possible resistance, necessitating cautious optimism in subsequent sessions. Investors should remain vigilant, considering both macroeconomic factors and sector-specific developments that could influence market sentiment. While the upside potential remains promising, the stock may face challenges near historical resistance zones. Staying attuned to trading volumes and market reactions will be key in navigating these choppy waters, enabling informed decision-making and capitalizing on emerging opportunities.